October 30, 2023
Today’s shoppers are not merely smart and savvy — they are focused on survival.
To capture a 360º view of the current state of spend in the US from both a shopper and marketer perspective — and understand how brands can influence shopper behavior — Ibotta recently conducted comprehensive surveys, listening to:
- 2,500 active American shoppers representative of US population (age, gender, income)
- 400 brand professionals including Management to C-Level titles across all major retail grocery categories
While it may be no surprise that 87% of shoppers are looking to save money right now, below you’ll find many more insights into the current state of the consumer mindset and which marketing strategies prove most effective.
Read on to see how marketers can reach today’s shoppers and drive incremental return at unprecedented scale.
Shopper perceptions & spending habits
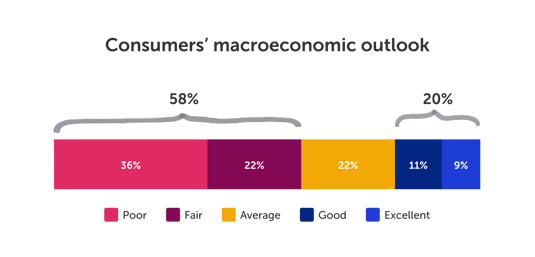
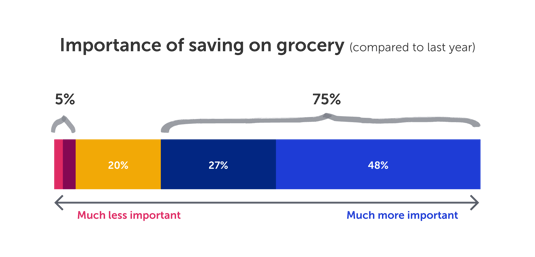
Even those with a positive view on the economy are inclined to feel the need to save. While 58% of shoppers rate their economic outlook as “poor” or “fair,” 87% believe saving money is important and 75% specifically consider saving on groceries to be more important than last year. Conversely, while 20% have a “good” or “excellent” outlook, merely 5% deem saving on groceries as much less important.
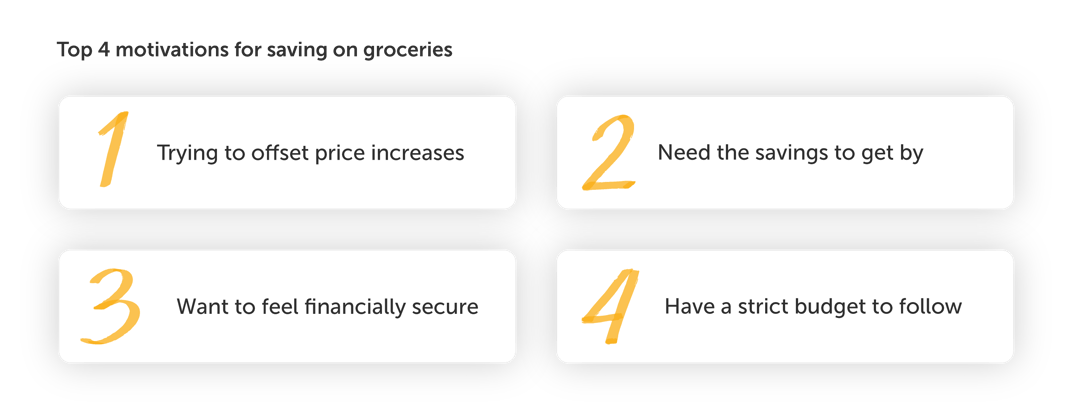
The primary motivations for saving on groceries, including the top priority to “offset price increases,” mirror headlines in the news and parallel the broader economic environment. Inflation and mounting grocery costs are amplifying overall expenditures across various categories, with food being particularly impacted.1
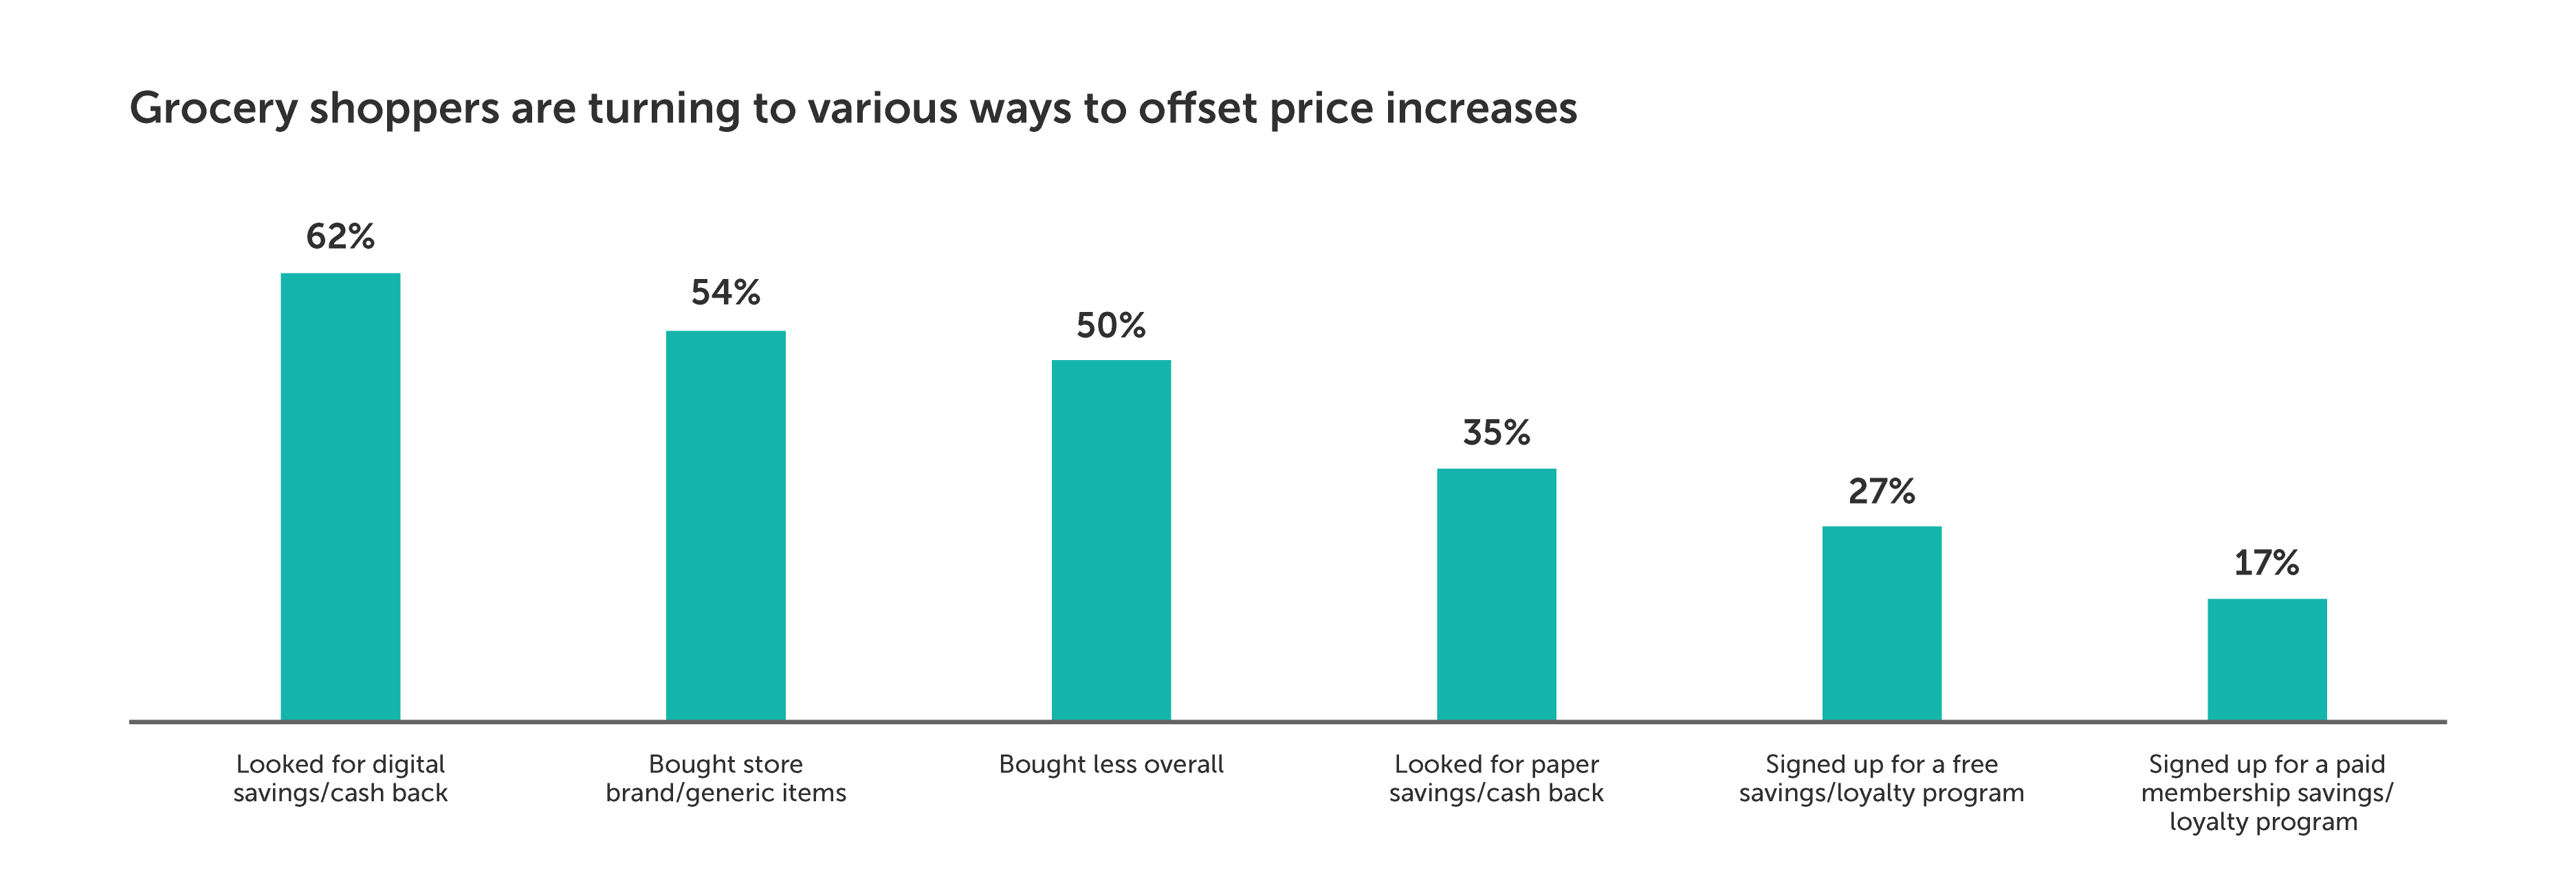
Furthermore, these reasons stem from sheer necessity. “To offset price increases," “to get by,” “to feel financially secure,” and to follow a “strict budget,” all underline a pressing ‘need’ rather than a ‘nice-to-have.’ Shoppers are turning to various methods to counter these rising costs, with digital offers and cash back being the primary means of doing so.
Marketing budget planning
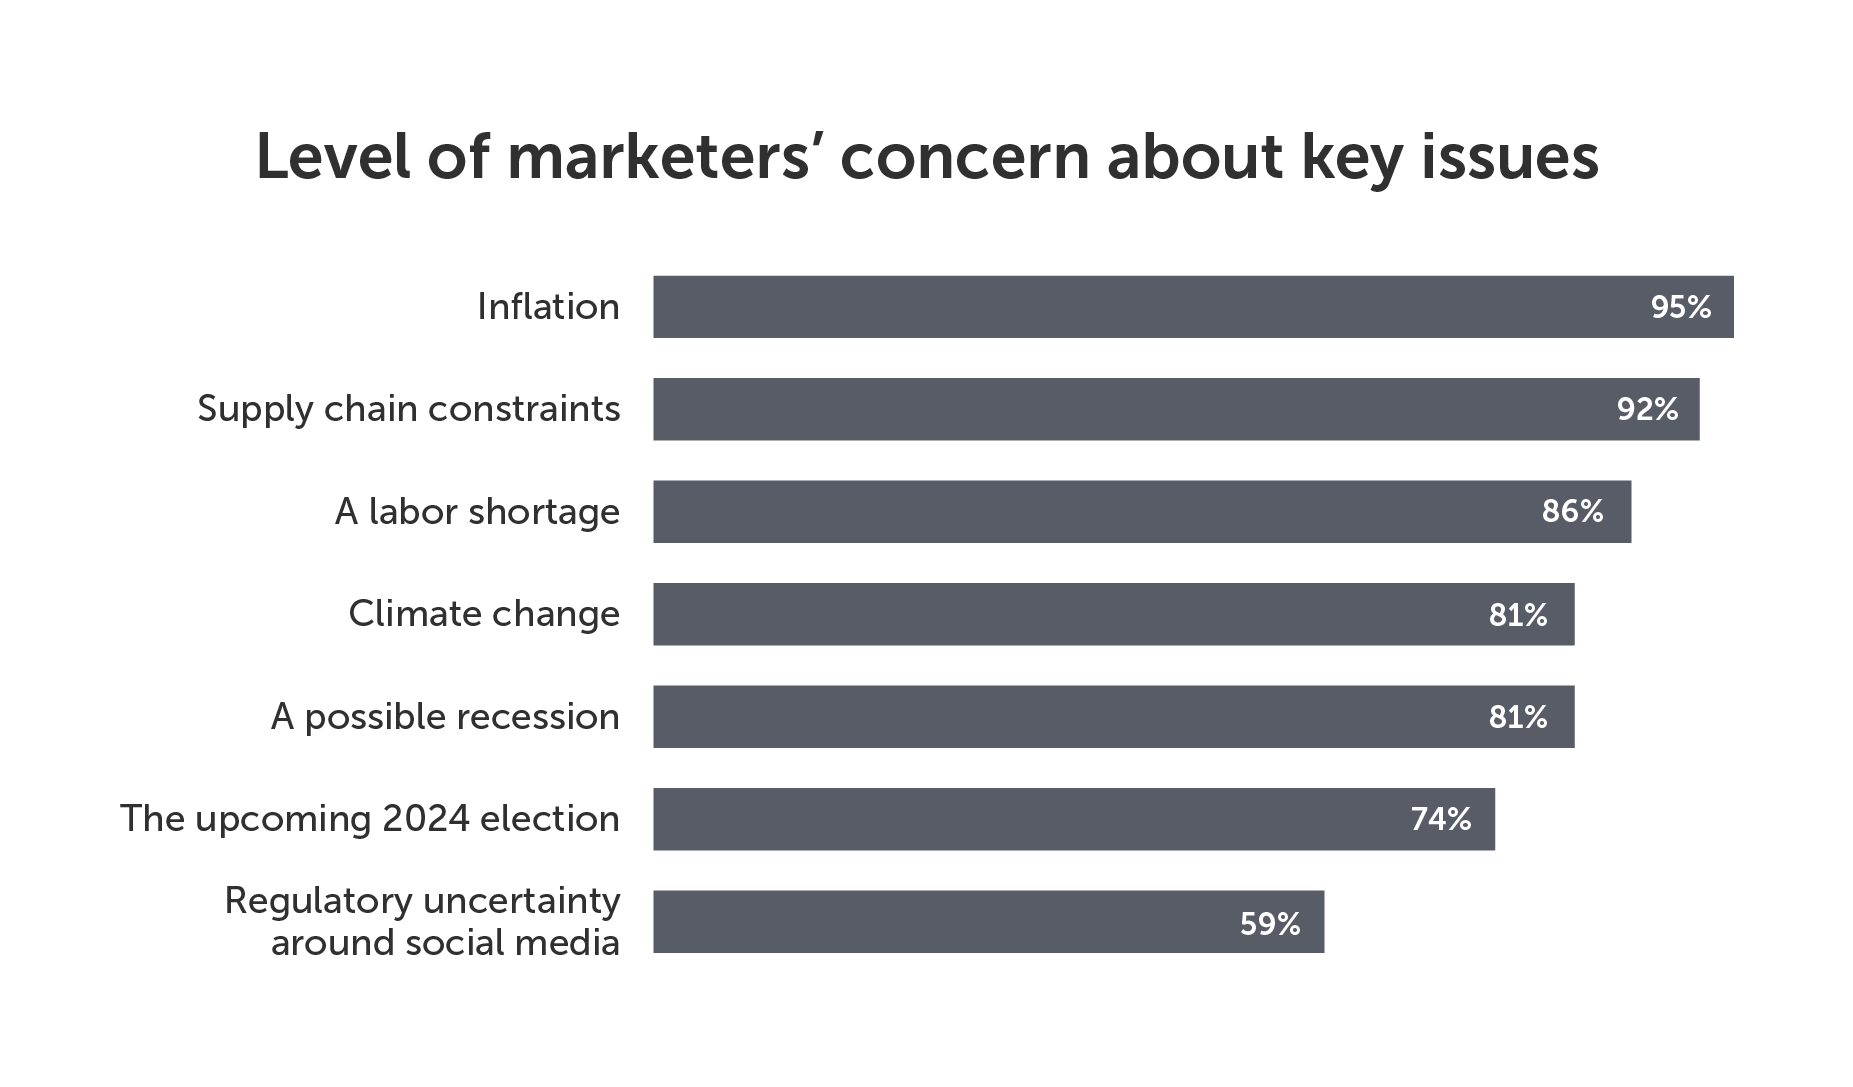
As noted, shoppers’ feelings toward the economy have a direct impact on their spending habits. Marketers are deeply concerned about the correlation between consumer perceptions and spending, in addition to the impact of economic factors such as inflation and supply chain constraints on their businesses.
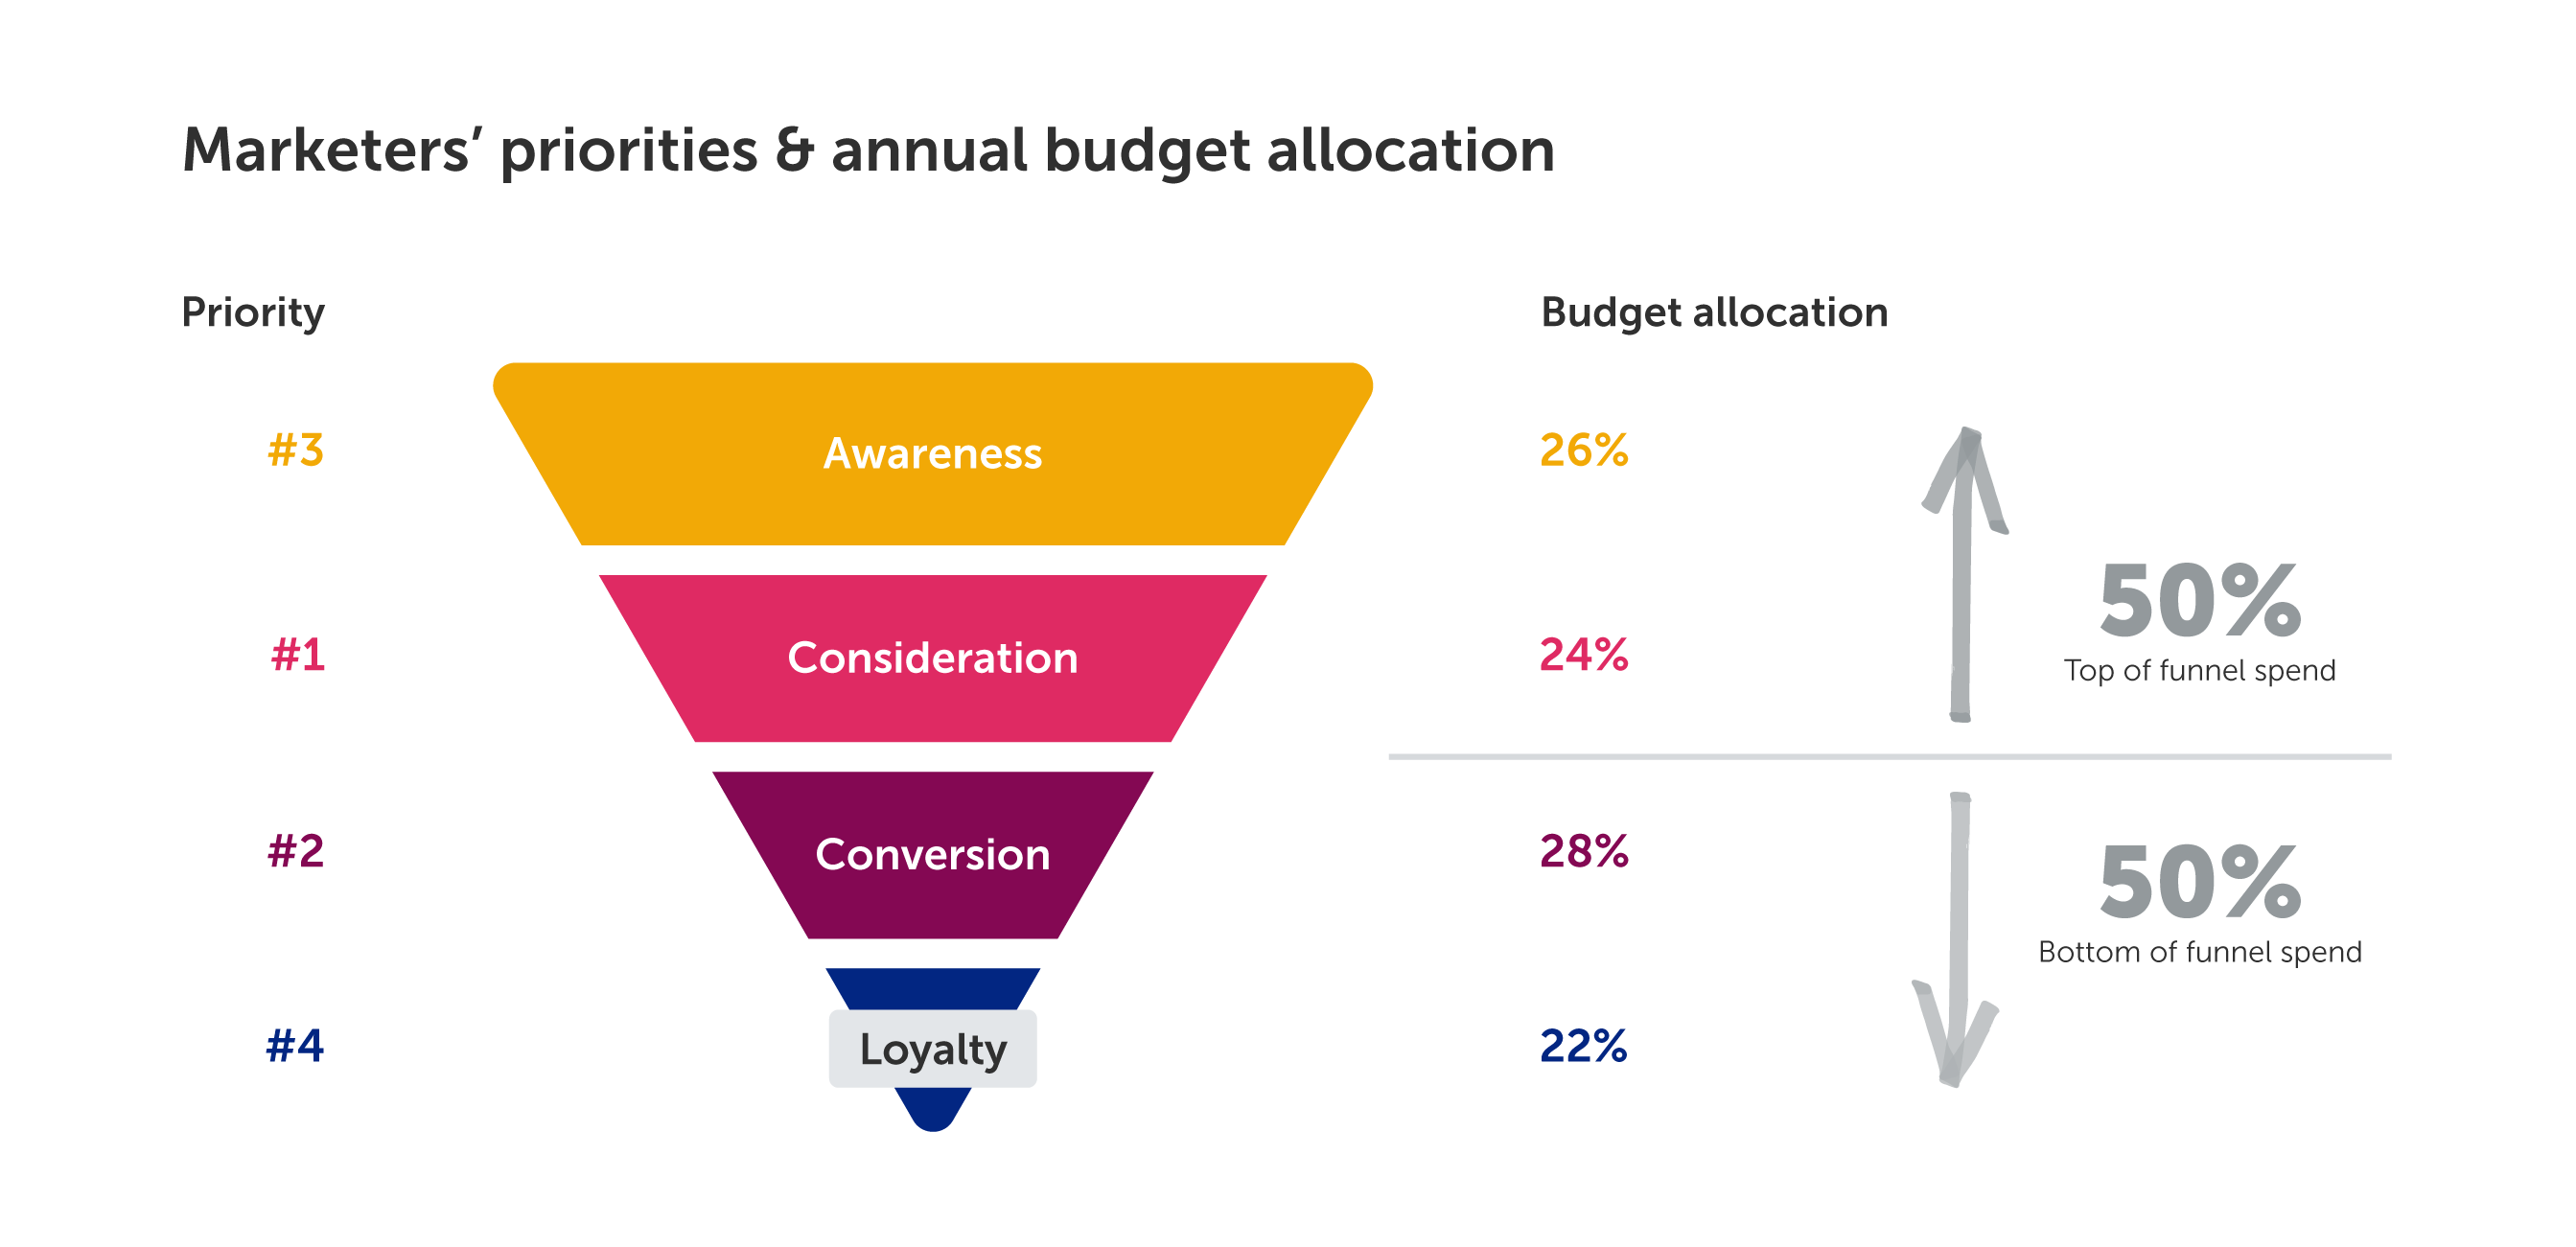
Amid such anxieties, marketers ranked key elements of the marketing funnel in order of prioritization and stated budget allocation by percentage. “Consideration” was prioritized highest, by a margin of 9%, yet budget allocations indicate an even split between top- and bottom-of-funnel spend.
With these full-funnel objectives in mind, marketers are most commonly using their digital-first channels this year, while they’re removing some time-honored tactics from their toolsets — such as in-store marketing and paper coupons.
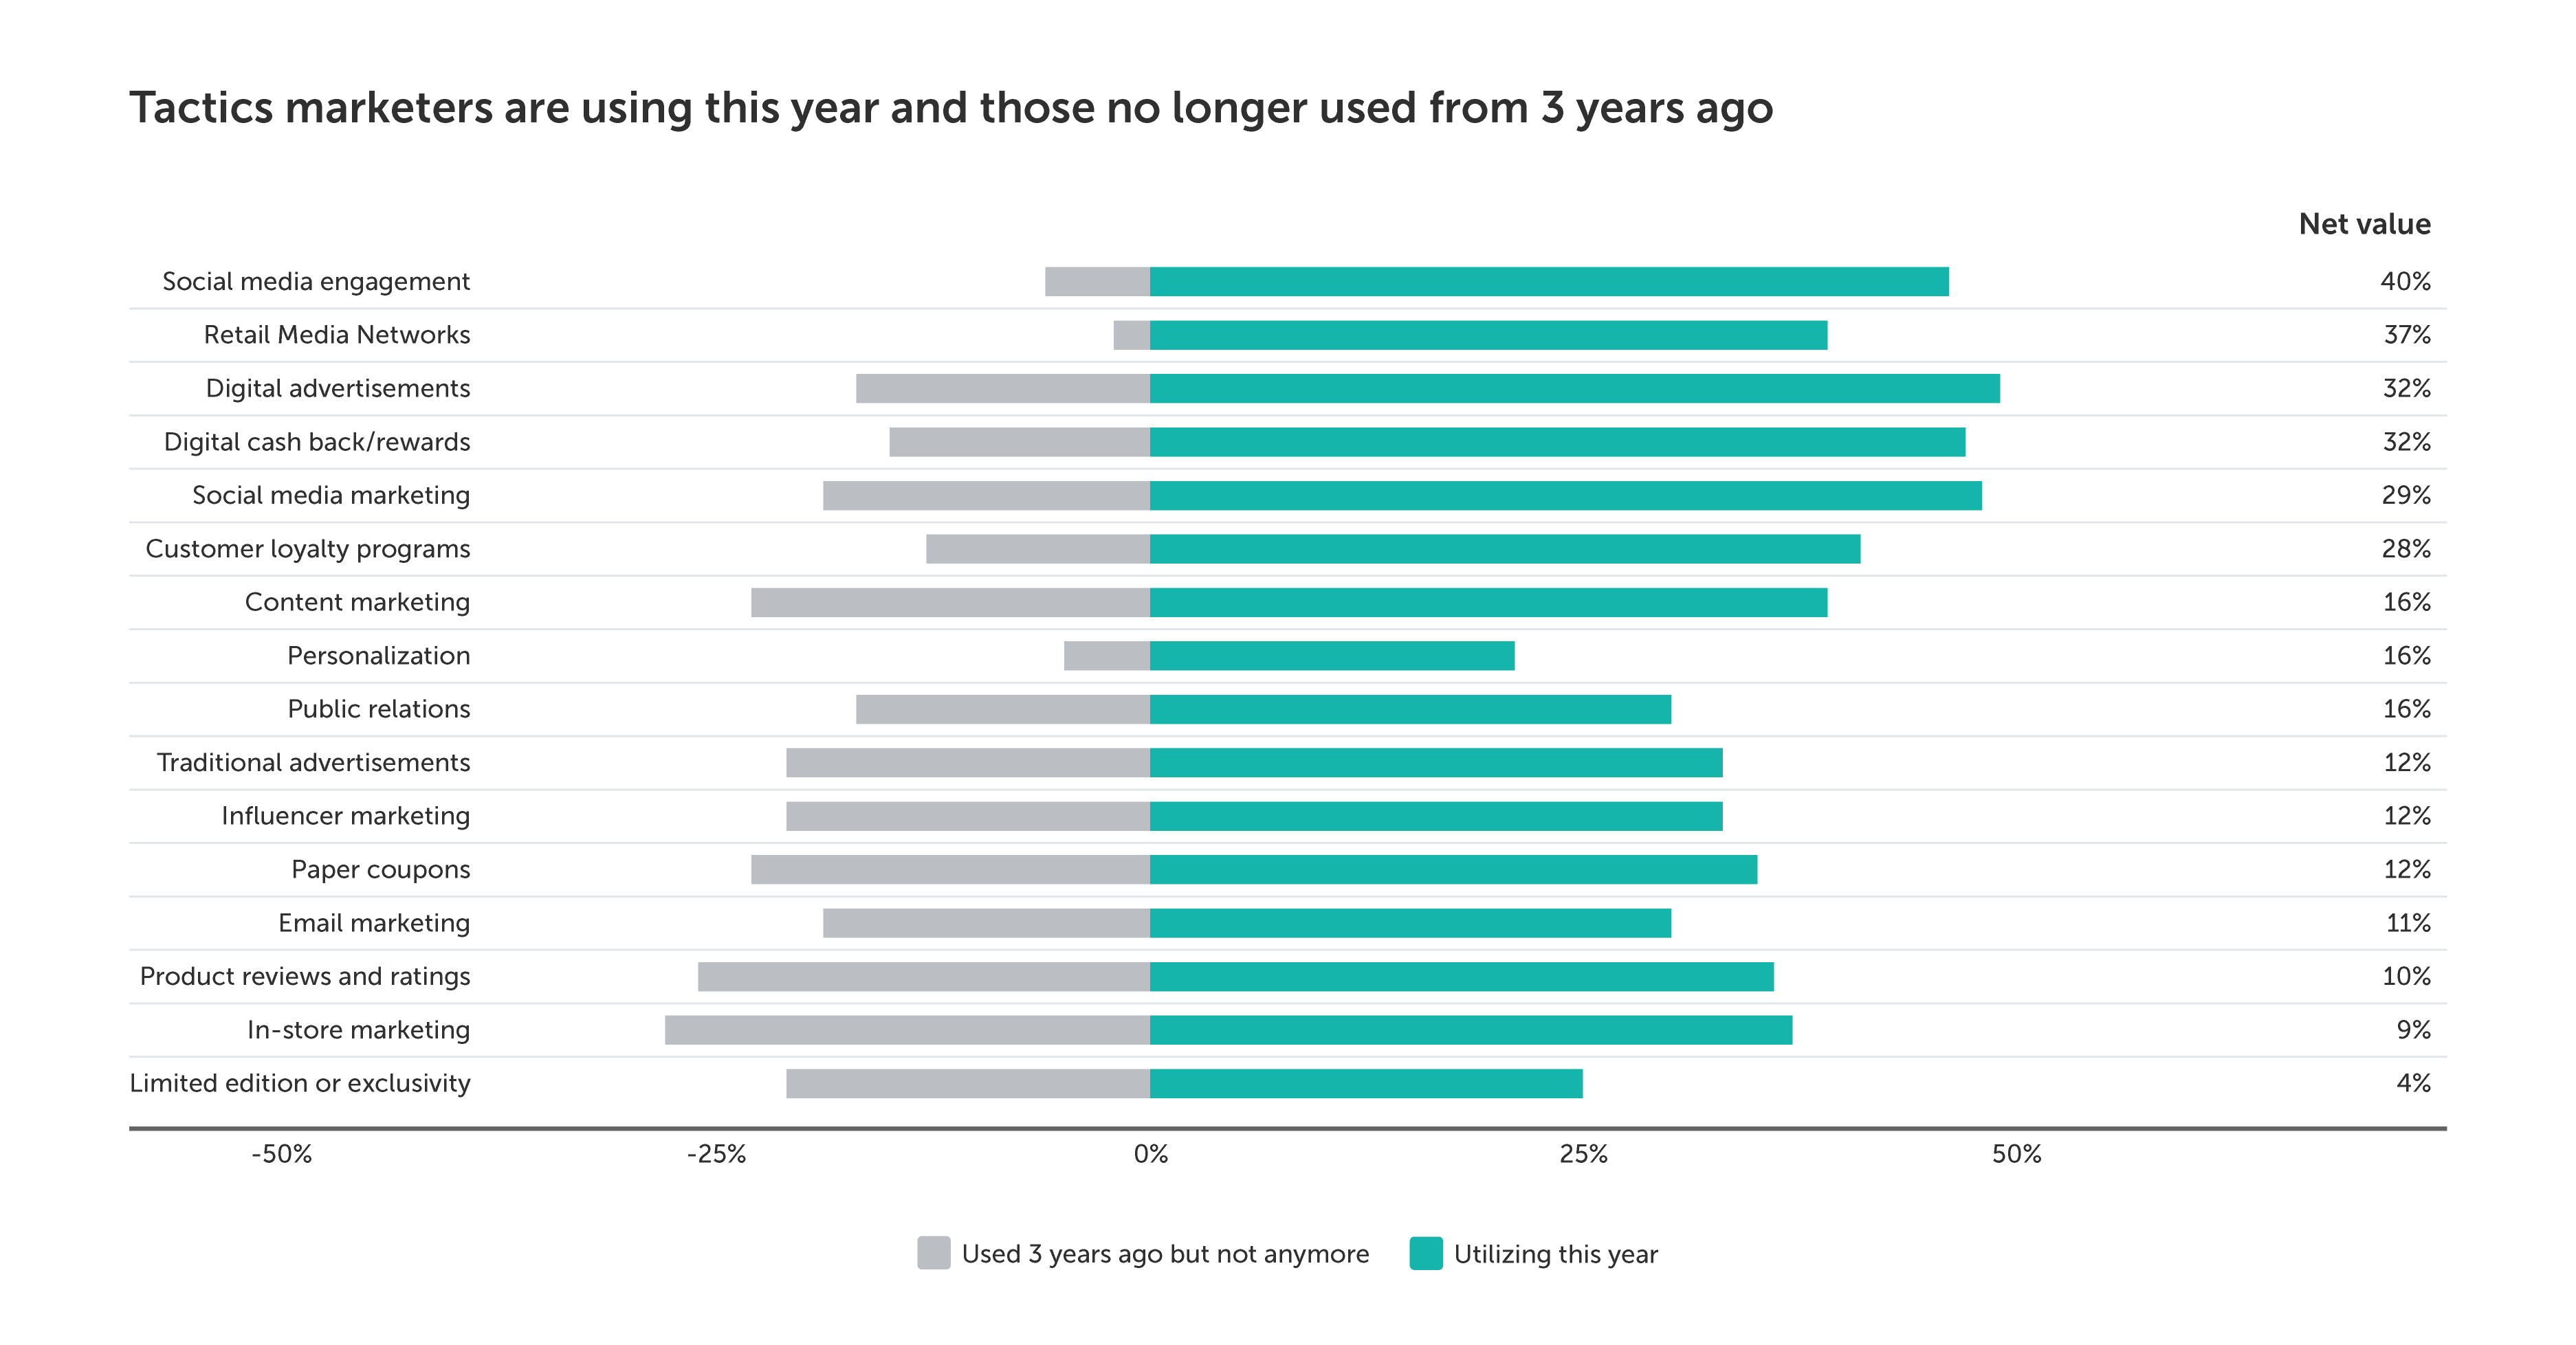
Brands leveraging the Ibotta Performance Network (IPN) are using the most popular tactics like Social Media, Digital Ads, and Loyalty Programs to deliver relevant digital offers, enabling a full-funnel approach to drive discovery, consideration, and incremental return.
How to influence shopper behavior
Priority #1: Timing
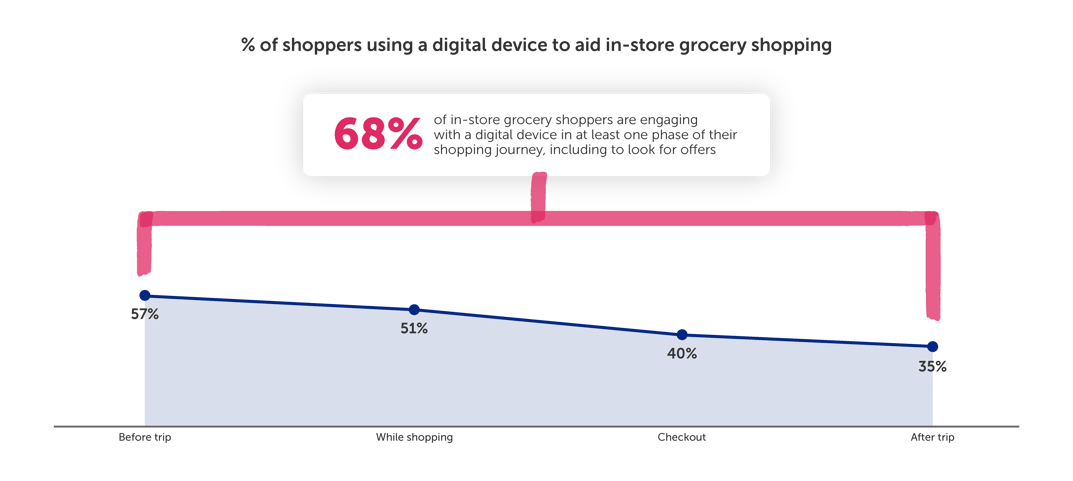
Throughout the in-store shopping journey, 68% of shoppers engage digitally. This presents a massive opportunity for brands and retailers to influence purchase decisions by delivering timely digital incentives, while shoppers are in store and actively seeking deals.
Of the in-store shoppers using a digital device to aid their journey, 57% look for deals before their trip, and 51% do so while shopping. This highlights the direct influence that digital offers can have on purchasing decisions — in the moment.
The graph below shows where shoppers are engaging with digital devices during their in-store journey.
And it’s no wonder so many marketers are focused on influencing consideration, i.e., getting shoppers interested to buy — because once they do, 87% of shoppers say that once they find a brand they like, they’ll stick to it.
Ibotta provides a variety of methods to deliver offers before, during, and after the transaction to drive incremental brand sales and repeat purchases.
- Before — Influencing with relevant offers to drive awareness & consideration
- During — Re-engaging to drive conversion
- After — Personalizing incentives to drive greater loyalty
Priority #2: Funnel tactics
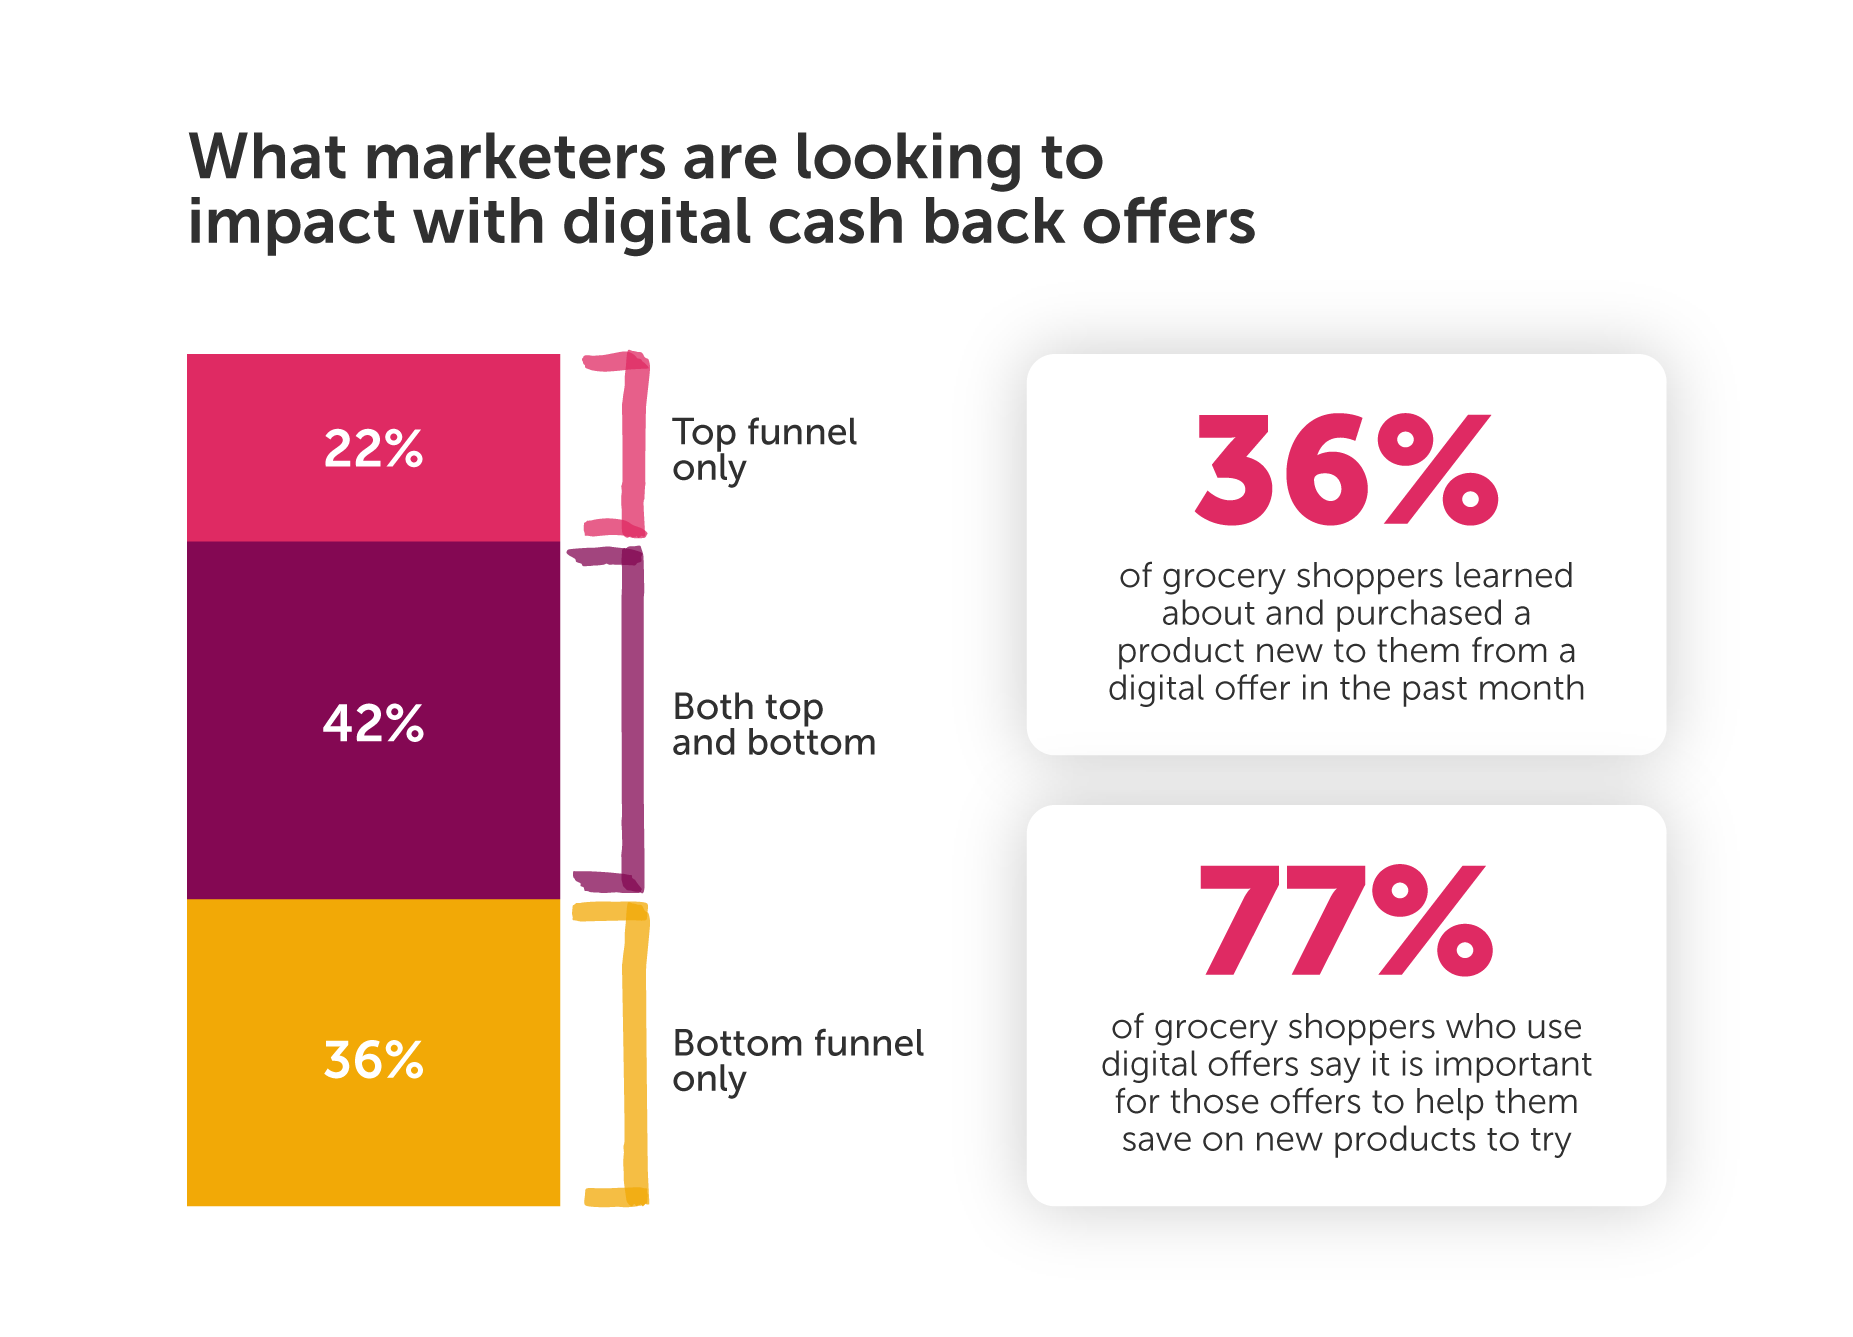
Digital cash back offers are impactful across full-funnel metrics — and this is validated by shoppers’ behavior and opinions. 36% of grocery shoppers learned about a new product they bought from a digital offer in the past month. With 77% who use digital offers saying it helps them save on new products to try, it’s important for brands to amplify their offers to reach shoppers at all stages of the funnel.
Consider 10 ways brands are activating their offers through top-of-funnel down to lower-funnel tactics:
- Video Integration: Incorporate digital offers within video content, such as tutorials or product demonstrations, to raise awareness and engagement.
- Email Marketing Campaigns: Send out targeted emails featuring digital offers to your subscriber list to encourage online and in-store purchases.
- Social Media Advertising: Promote digital offers on social media platforms through sponsored posts and paid advertising campaigns.
- Influencer Partnerships: Collaborate with influencers to share and endorse your digital offers, reaching a wider audience.
- Mobile Apps: Implement digital offers within mobile apps like Ibotta and Walmart to engage and reward loyal customers.
- Website Pop-ups: Display digital offers in pop-up windows or banners on retail websites to capture the attention of online shoppers.
- SMS Marketing: Send text messages with exclusive digital offers to opt-in customers, driving immediate action.
- Geo-fencing: Use location-based marketing to send digital offers to shoppers when they are near a physical store.
- QR Codes: Place QR codes on in-store signage and printed materials to direct customers to digital offers or discounts.
- In-Store Promotions: Feature digital offers prominently at the point of purchase in-store, encouraging impulse buying and increasing basket size.
Priority #3: Digital dominates
While consumers are seeking lower price points and pricing incentives, they have a strong preference for digital channels vs. traditional. Digital offers are the way forward.
38% of all in-store and 59% of all online grocery shoppers are using a digital device specifically to search for digital coupons or cash back offers at some point in their shopping journey — percentages which are expected to surge as national paper coupons become obsolete.
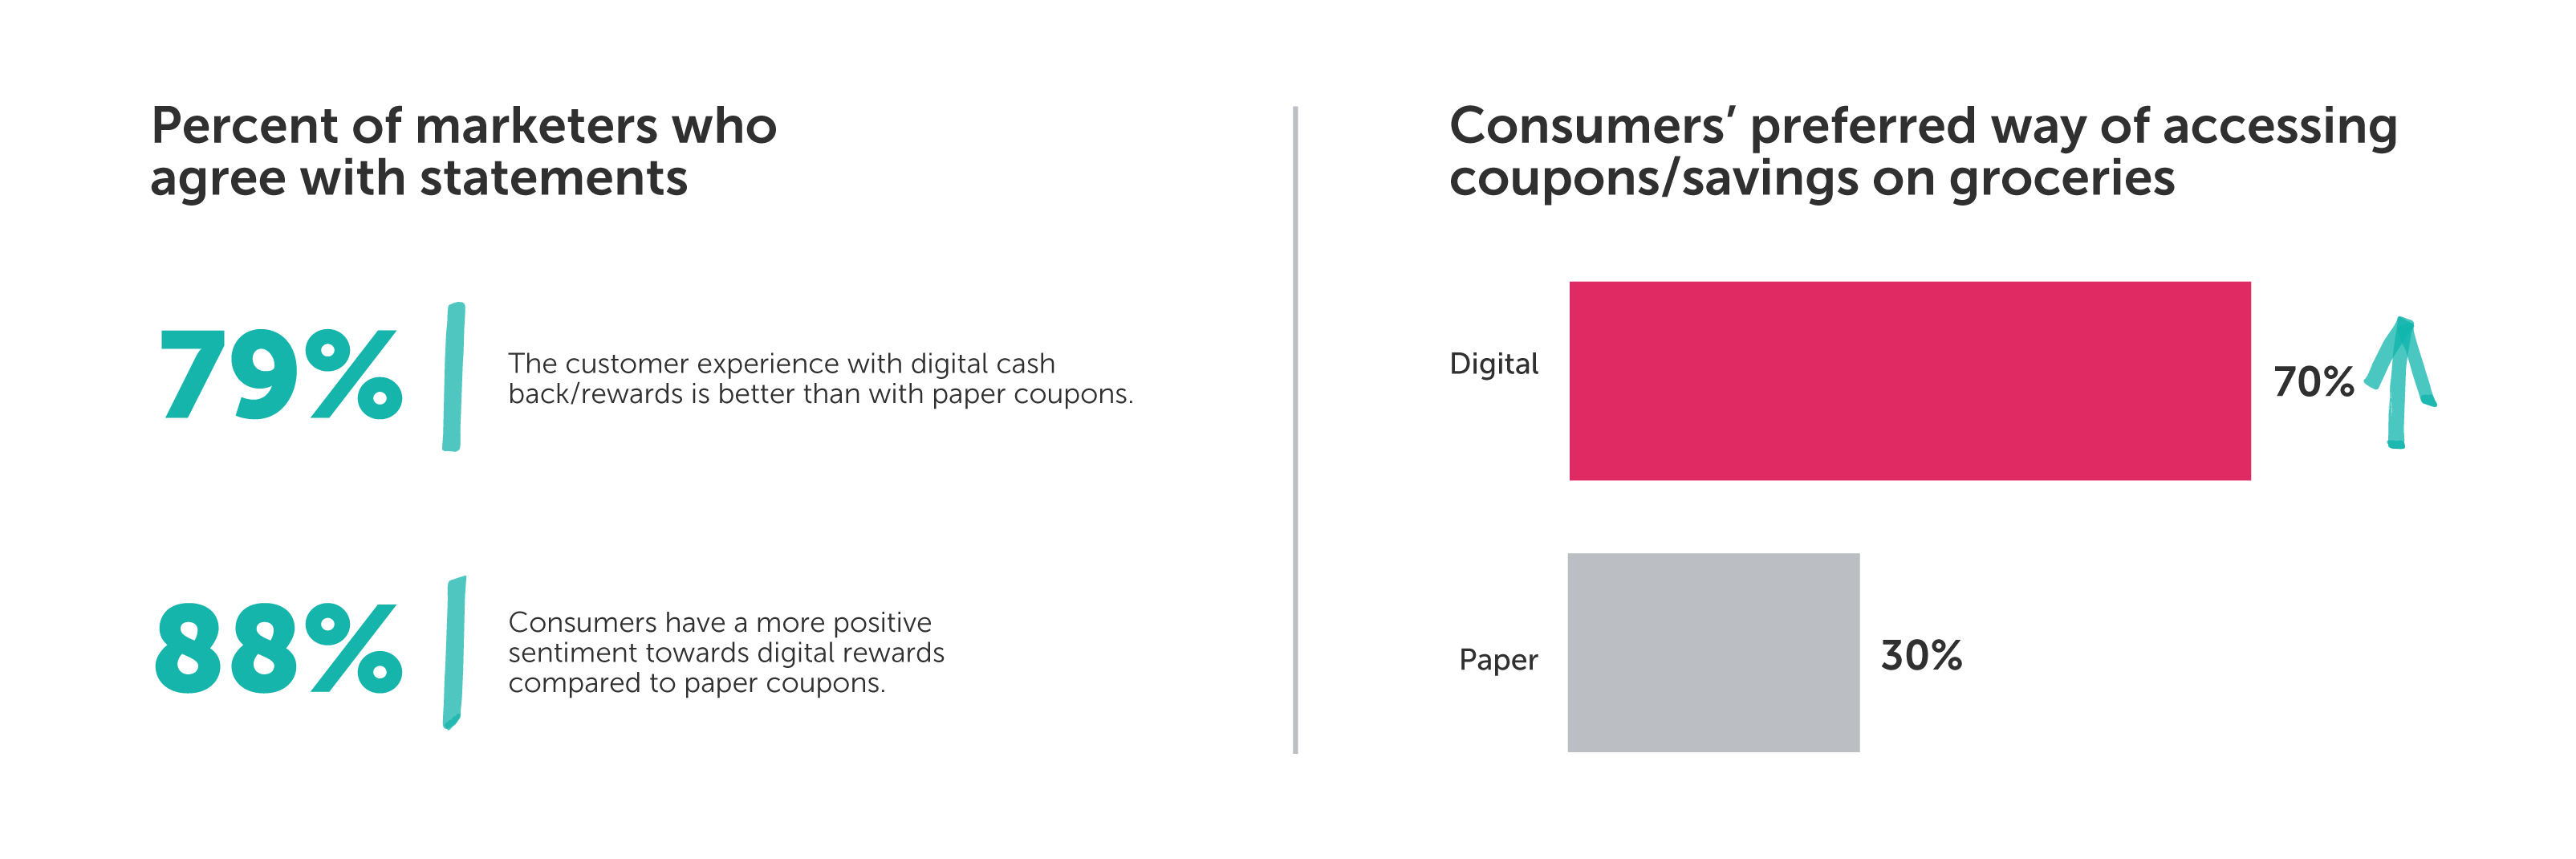
Marketers believe that a consumer experience driven by digital rewards is better than one of paper, and consumers share that sentiment. Not only are digital rewards easier to use and strongly preferred by consumers, they also empower marketers to measure the performance of their campaigns and intelligently optimize in real time. There’s no substitute for the depth of data that digital offers provide.
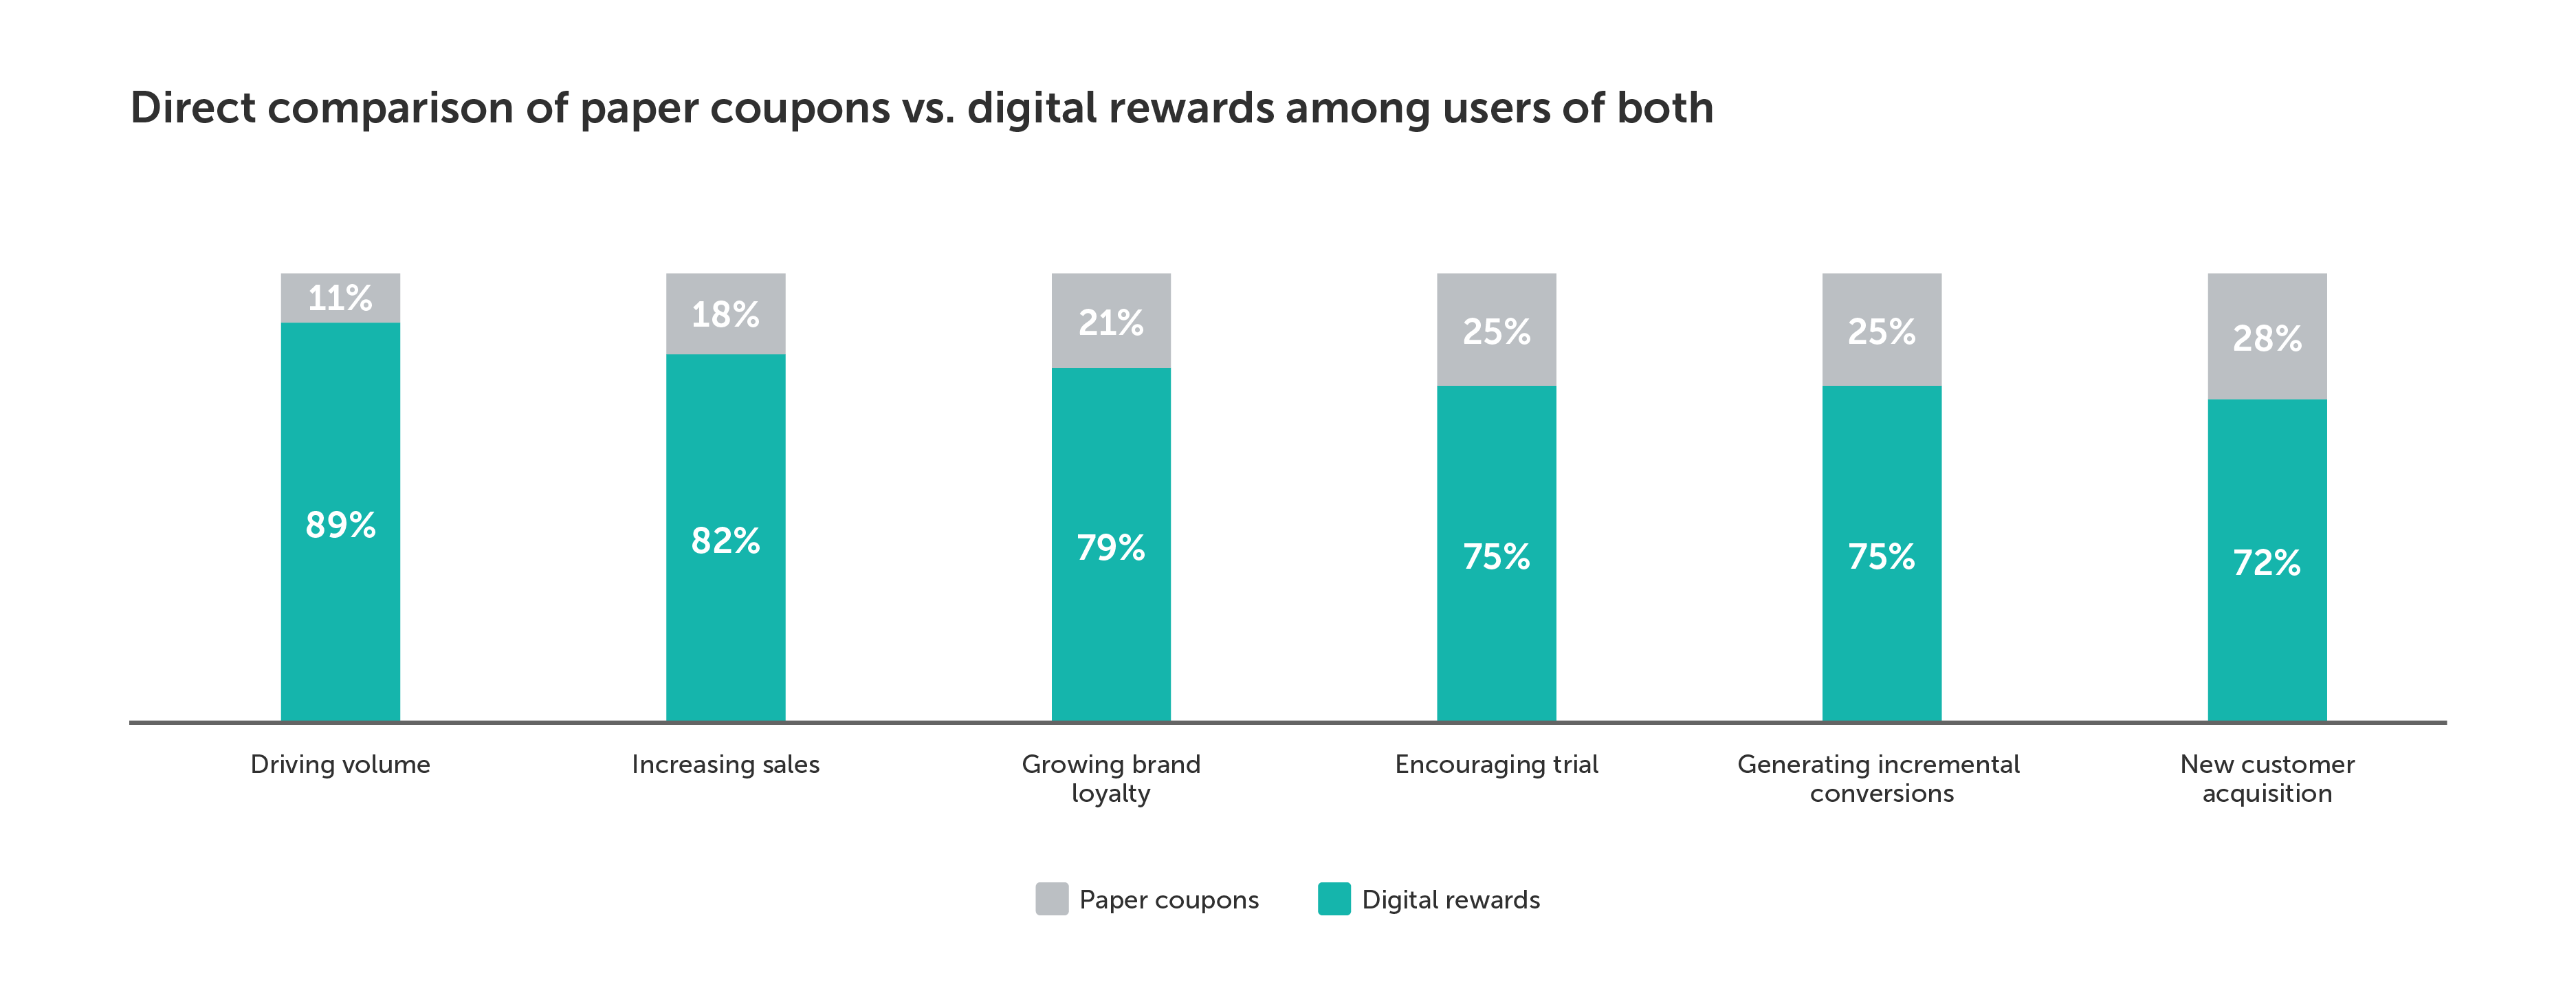
Marketers who use both digital rewards and paper coupons in their strategies consistently agreed that digital rewards are significantly more effective than their paper counterparts in achieving each of the goals shown below.
Priority #4: Turning new-to-brand shoppers into loyalists
While 75% of shoppers are willing to try a new brand if it’s offered at a lower price (assuming the quality is equal) digital offers are also an effective method for guiding them toward becoming brand loyalists.
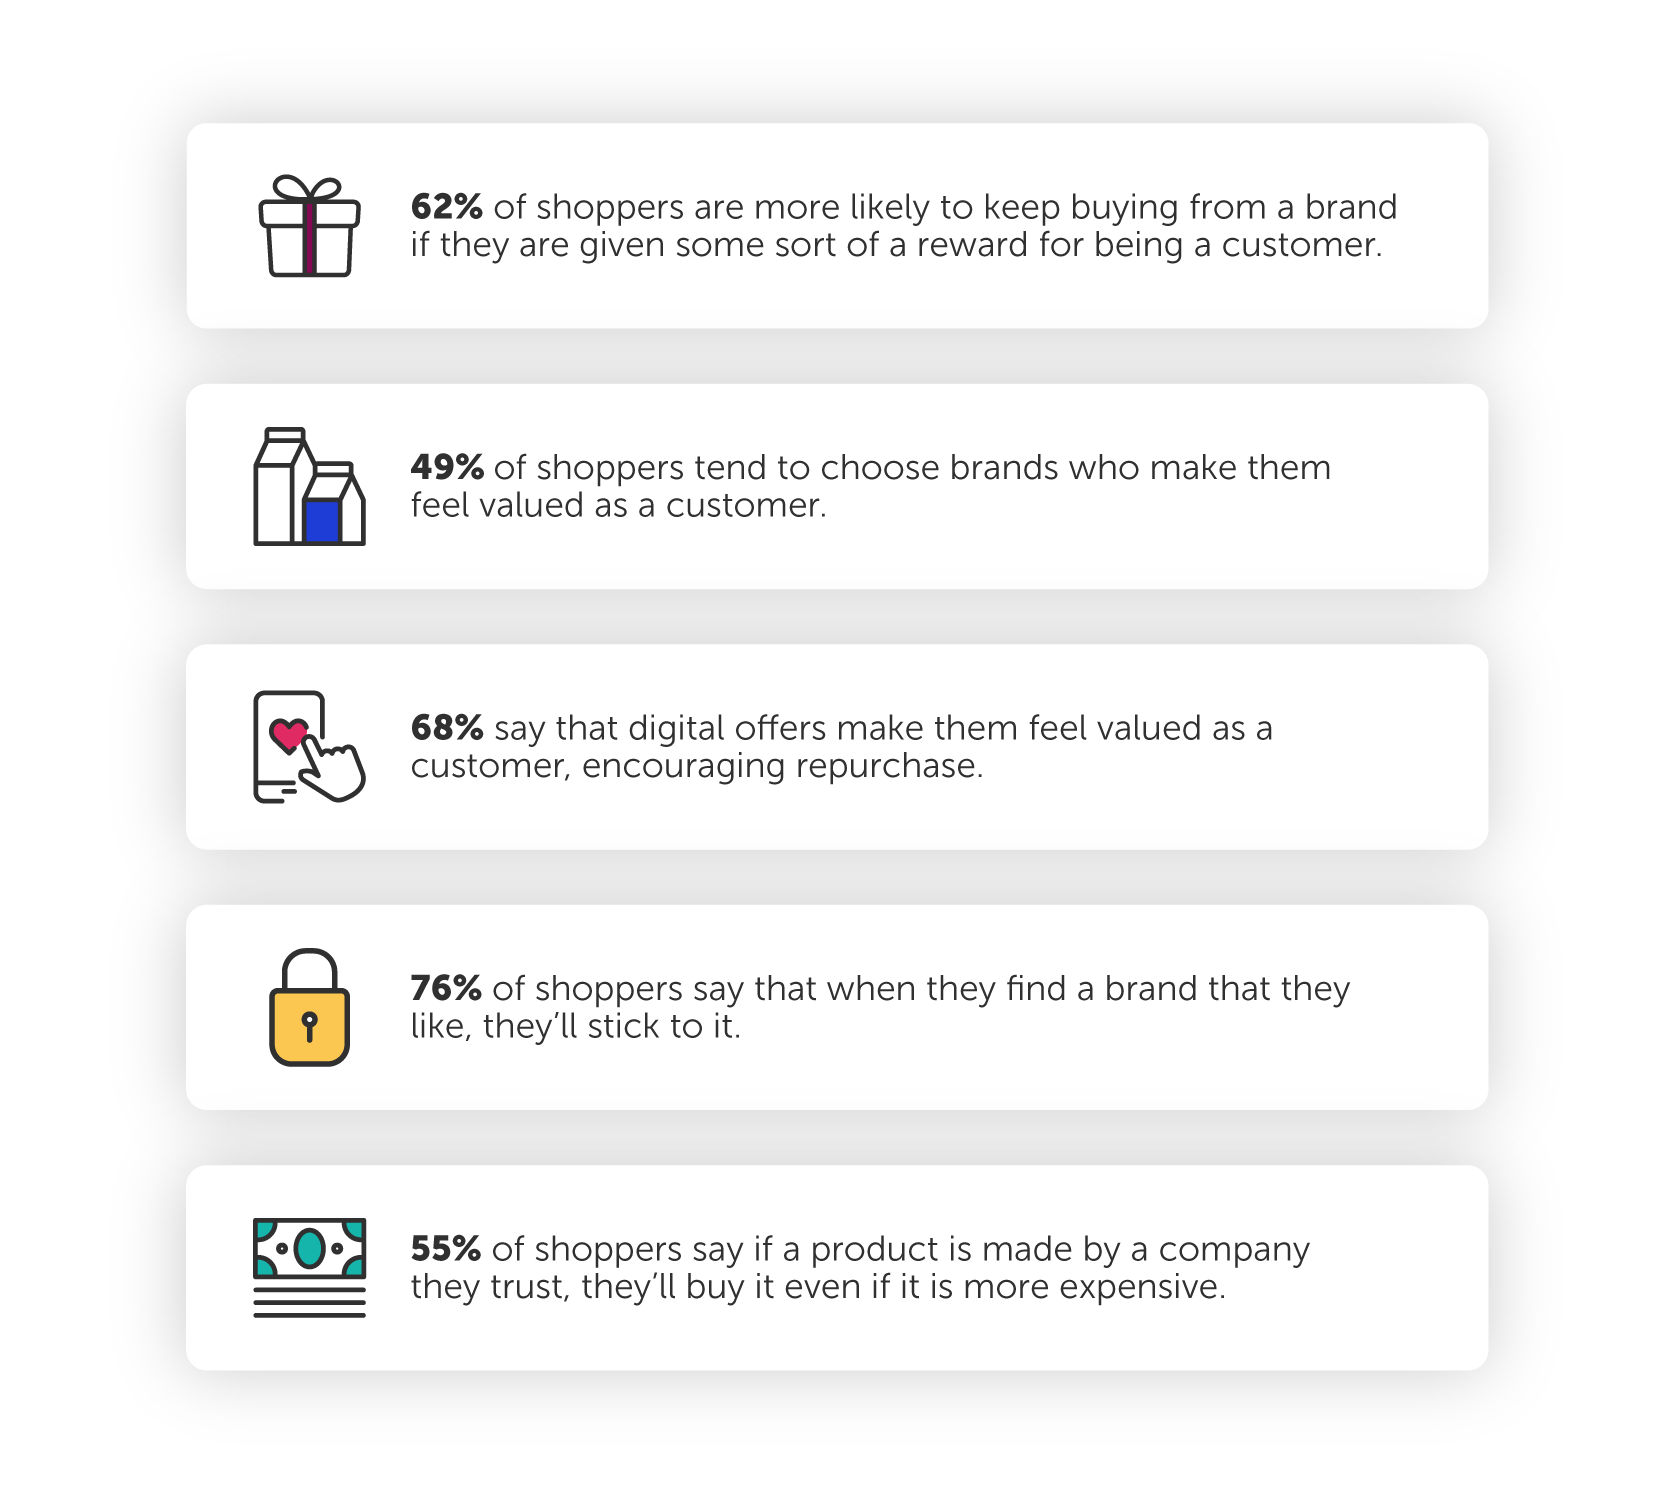
Creating affinity, loyalty, and trust is key to retaining customers and encouraging repeat purchases.
Priority #5: Turning loyalists into advocates
Digital offers don’t just incentivize loyalty, they also fuel advocacy. Once a brand captures a shopper, they’re then able to drive brand recommendations through that new brand enthusiast by way of digital offers.

Key takeaways & actionable steps forward
Given the rise of discerning, price-conscious shoppers, brands must prioritize full-funnel strategies that excel in delivering outstanding value. The tremendous influence of digital offers on consumer behavior and spend is undeniable: driving new-to-brand purchases, fostering brand loyalty, fueling customer advocacy.
Digital offers delivered at the right time with the right message give brands a high-impact avenue to connect with today’s shopper.
Even so, within the realm of digital offers, it’s important to recognize that not all are created equal — the IPN is 100% pay-per-sale with proven effectiveness.
Ibotta’s AI-driven network empowers brand partners through the strategic use of incentives to:
- Shape consumer purchase decisions, influencing not only what people buy but also where and how frequently they shop.
- Precisely target ads and promotions using the well-established historical purchase behavior of individual consumers.
- Track ad performance from initial engagement to confirmed sales, whether in physical stores or online.
Advertisers on the IPN average:
- 6X incremental return
- 41% incremental lift
- 42% of conversions new-to-brand
- 70% shorter purchase cycle


