October 15, 2024
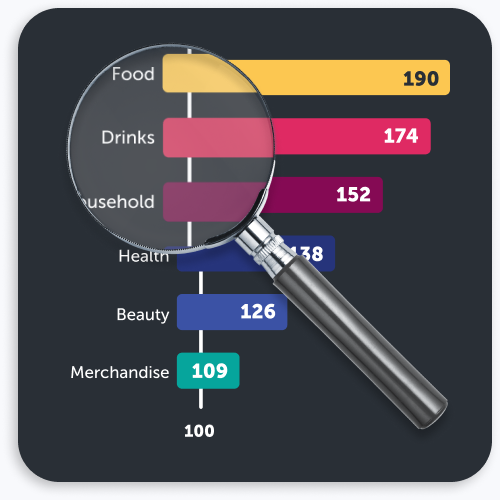
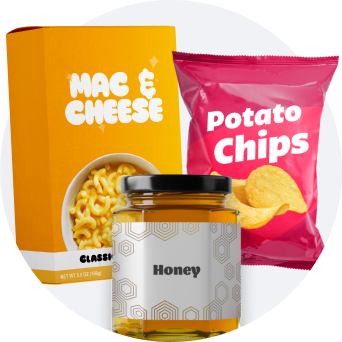
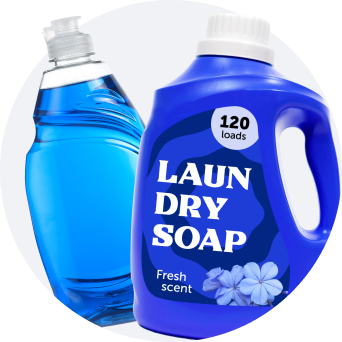
Students have returned to school and the weather is shifting toward fall temperatures. That means cold and flu season is officially upon us and with it comes a shift in grocery shopping trends. While August saw a spike in office and school supplies, our Category Pacesetters tool shows September brought a jump in purchases of health and wellness and household needs items, like detergents, soaps, and honey. In addition, items falling under these categories have shifted in favor of branded products since last year, a change from last month’s movement toward private label.
Overall grocery shopping trends
Though there has been a jump in these specific products, overall grocery shopping trends haven’t seen the same lift. Across all categories, we’ve seen a continued downtrend in store trips, dollars spent, and units moved year over year. However, there has been a move to branded products in three of five major categories, with only beverage and general merchandise leaning toward private label.
Specifically, the general merchandise category has seen much larger gaps YoY than our other tracked categories. GM products have made a nearly 40% shift toward private label and have dropped more than 25% in store trips, dollars spent, and units moved.
September 2024 grocery shopping statistics
How the IPN can help
What do these statistics mean for marketers? With drops in grocery trips and spend overall, marketers need to work even harder to get shoppers in the door. Enter: the Ibotta Performance Network (IPN).
The IPN allows marketers to stay up to date on category trends for incentivized and organic purchases both in store and online across major U.S. retailers with first-party, SKU-level data. This provides insights into shopper behavior that can be used to inform and power high-performing marketing campaigns.
