June 5, 2025
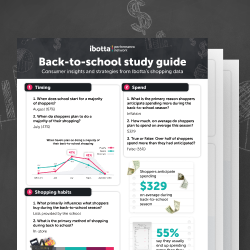
The school supply shopping season is fast approaching and that means it’s time for a pop quiz: Are you prepared to meet the demands of today’s back-to-school shopper? Welcome to Back to School 101, your curriculum for success based on the latest consumer insights and seasonal purchase trends from Ibotta’s shopping data.
Uncover the key factors influencing purchase behavior this year, from the budget-conscious consumer mindset to the dominance of school supply lists and the power of deals. Plus, dive into year-over-year data from popular school shopping categories to help you craft effective marketing strategies and drive incremental sales. Get ready to take notes — class is now in session.
Understanding the back-school shopper & seasonal purchase trends
In early April, we conducted our annual survey of over 1,000 users of the Ibotta app who plan on back-to-school shopping this year. The results uncovered four key takeaways brands and retailers need to know regarding timing, spending, shopping habits, and the role of deals during back to school.
Trend #1: Shoppers are planning their purchases and buying earlier
When majority of shopping will be done
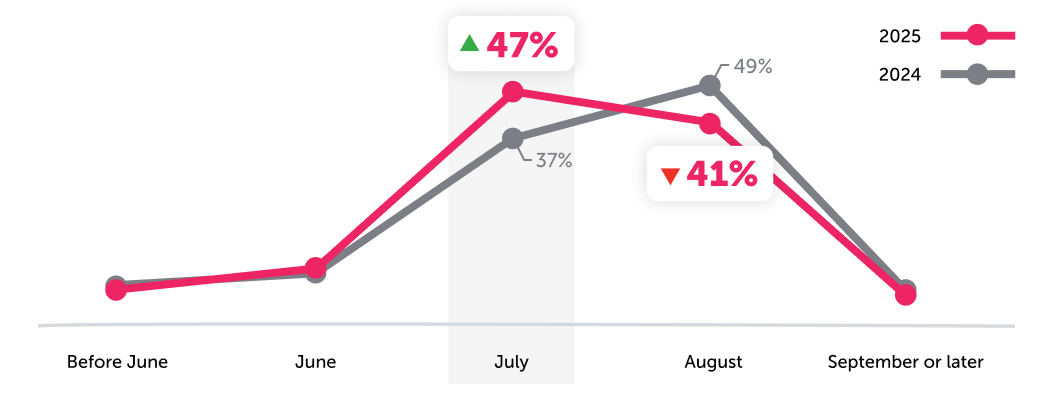
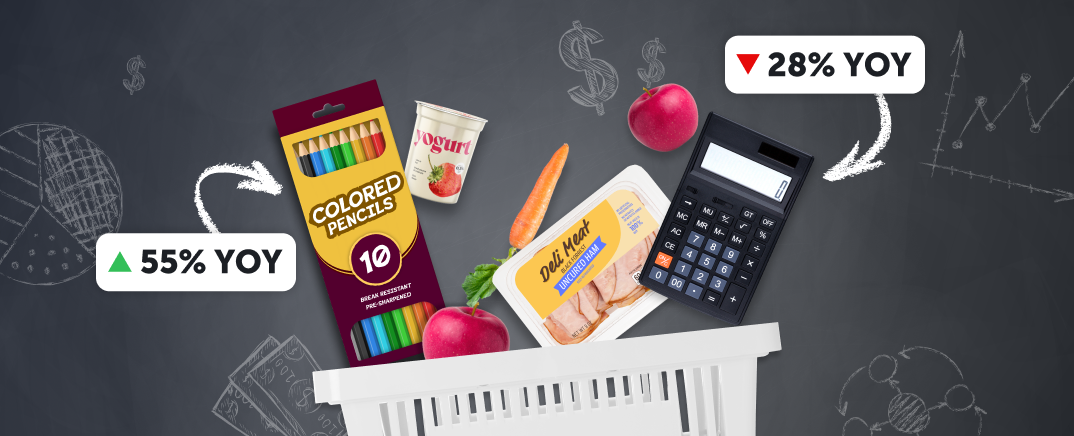
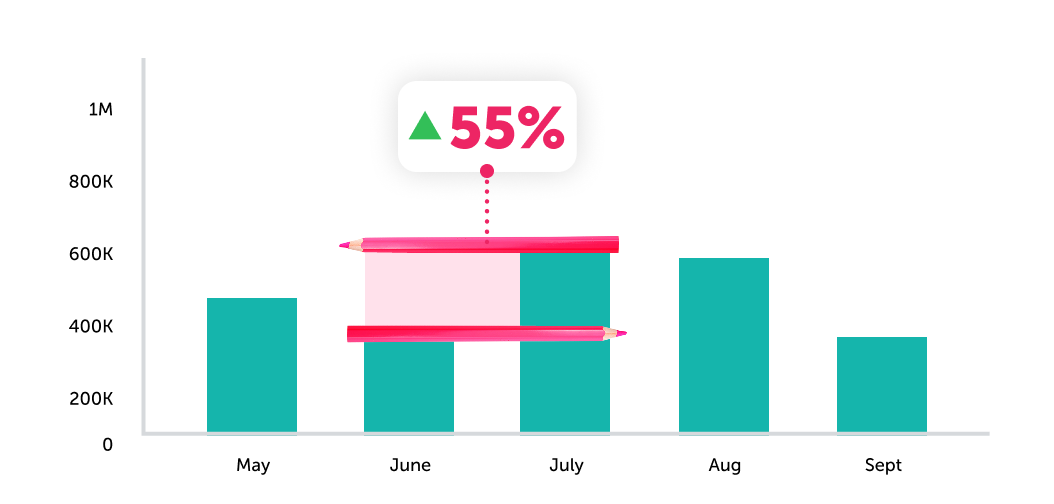
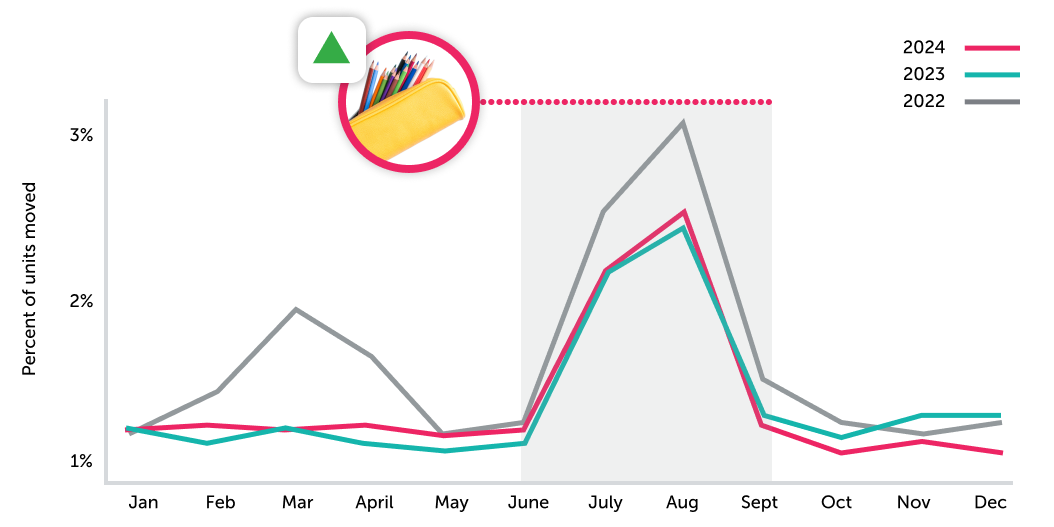
School starts in August for most of our survey respondents (67%). Although the start date is similar to years past, we’re seeing a clear shift toward earlier back-to-school shopping this season. Shoppers will do most of their shopping in July, a 10% increase from 2024. This shift from the majority of purchases occurring in August to July could mean shoppers are planning ahead to try to get the best deals possible. Our receipt data over the last three years show that categories like craft supplies — which include coloring, crafts, drawing, and painting purchases — generally peak in July. For example, units moved for craft supplies increased by 55% from June to July 2024, showcasing how families stock up for the back-to-school season.
Units moved for craft supplies in 2024
July and August appear to be the primary back-to-school shopping window, but early planners extend the season even further. Back-to-school planning — such as budgeting, deal seeking, list making, and more — starts up to two months before shoppers purchase their items. Over a third of surveyed shoppers (37%) are planning their purchases in June or earlier. It’s clear shoppers are planning their purchases and buying earlier, indicating that marketing strategies also need to adjust to win the season.
When Savers plan on doing a majority of their back-to-school shopping
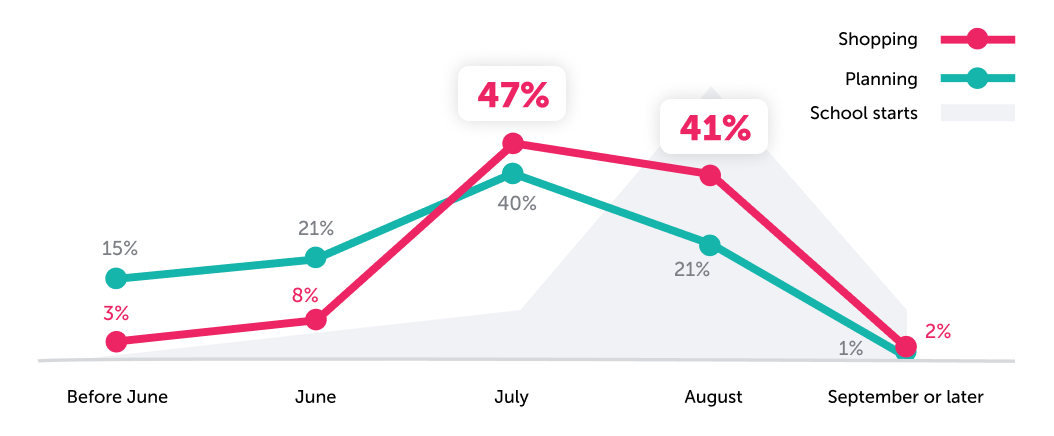
How you can respond: With such a high propensity for shoppers to plan and make their purchases early for back to school, brands and retailers need to execute their marketing strategies well in advance of when the school bell rings. And digital promotions are an effective strategy to tap into. Our Back-to-School Brand Guide recommends launching promotions early, ensuring your brand is top of mind when shoppers make their lists. June is a great time to start, as your brand can reach consumers during the crucial consideration phase of the purchase cycle.
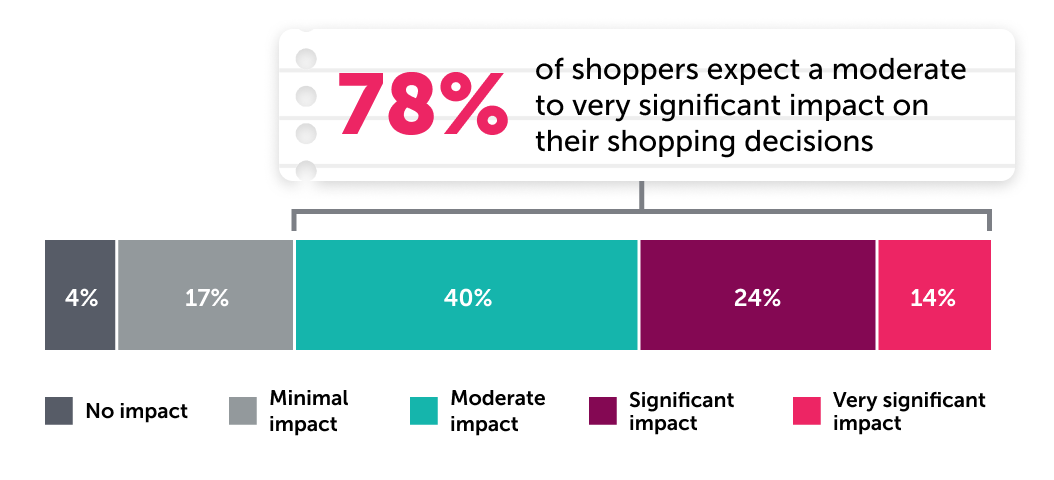
Overall, how much do you expect rising prices to impact your back-to-school shopping decisions this year?
1,000+ Ibotta users who plan to participate in back-to-school shopping in 2025.
Trend #2: Rising prices make shoppers cautious about their spending
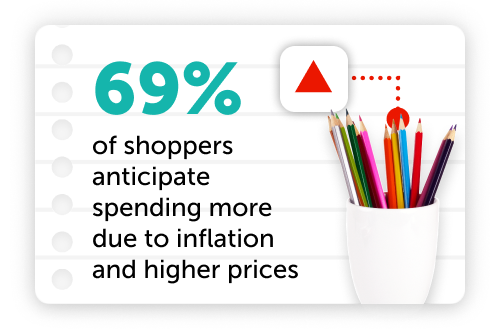
Prices are top of mind for the back-to-school shopper. Over three-fourths (78%) expect rising prices to have at least a moderate impact on back-to-school shopping this year, with 38% expecting a significant impact. Various economic factors influence this price-sensitive behavior such as evolving trade policies, supply chain issues, and inflation. When asked, inflation is the leading cause among those anticipating spending increases, at a significant 69%.
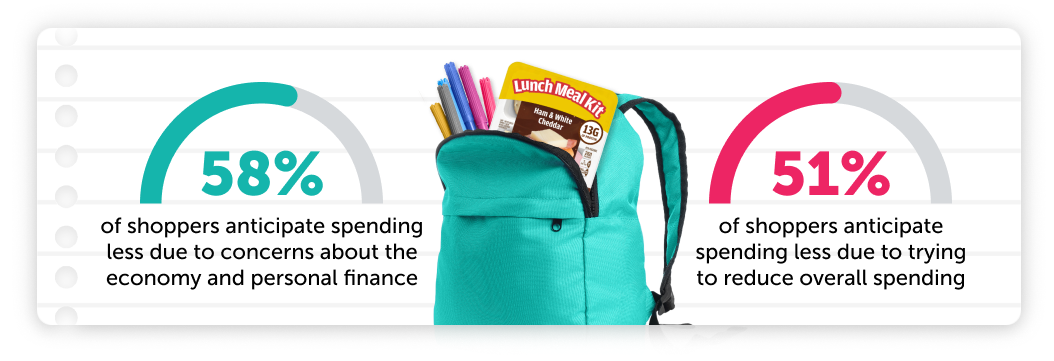
As a result of these economic concerns, many shoppers plan to reduce spending. When asked about their reasons for spending less, 58% of survey respondents attributed it to concerns about the economy. Another 51% of shoppers are trying to reduce spending overall.
(Among those planning to spend more this year)
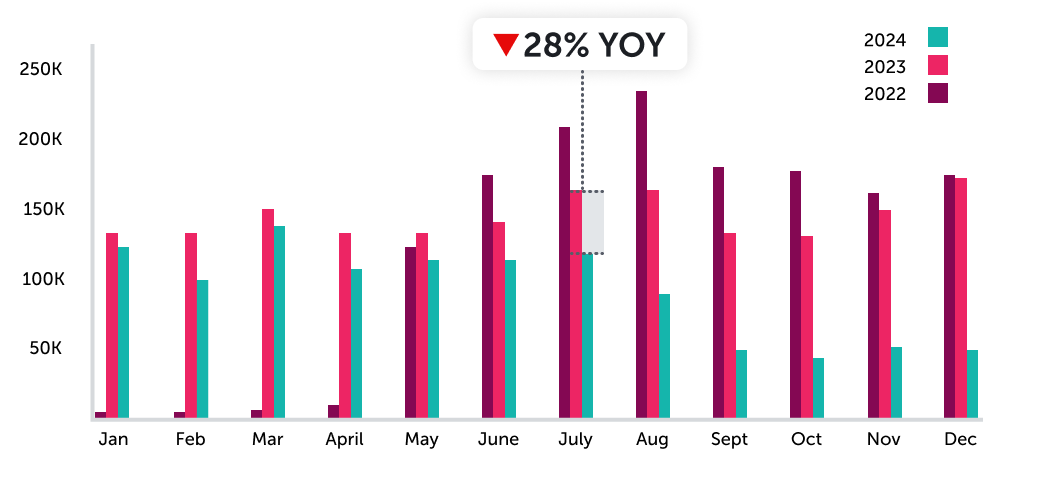
This could be why we’re seeing fewer purchases over the years in more discretionary back-to-school categories like electronics. Although we see a spike in purchases during June, July, and August when compared to the rest of the year, there's been a decline in units moved each year since 2022. Our electronics category looked at cell phones and accessories as well as computers, tablets, and office electronics. There was a 28% decrease in purchases for these items in July of 2024 compared to July of 2023 and other back-to-school shopping months also saw similar declines year over year. This indicates that economic pressures are causing shoppers to potentially opt to use what they already have instead of buying new.
Units moved for electronics
(Among those planning to spend more this year)
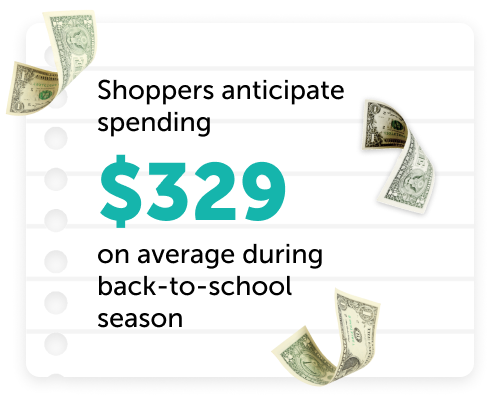
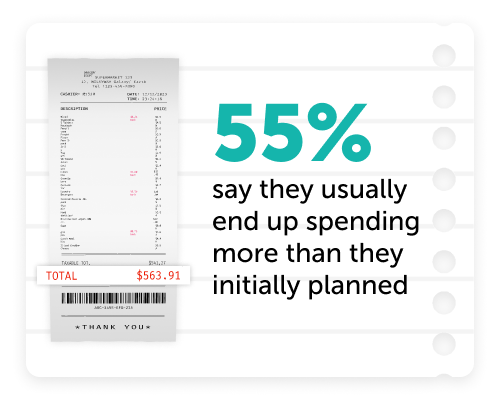
Even with economic pressures at hand, less than half (49%) of respondents plan to set a back-to-school budget. The absence of budgeting could be due to school supply lists — typically provided early in the summer by the school system — which essentially make a required budget for the shopper. Budget or not, our survey data shows shoppers anticipate spending $329 on average during back to school. However, 55% say they usually spend more than they initially planned. This awareness of higher spending than initially allocated could push a shopper to be even more aware of prices this year.
How you can respond: Since shoppers are more price sensitive than ever, managing pricing and quality is a must for brands. Both CPG and general merchandise brands can offer tiered pricing, value packs, or buy-one-get-one (BOGO) discounts to cater to budget-conscious shoppers. Digital promotions can be an effective way to offer these types of discounts with little effort. Your brand can adjust the offer parameters to create a BOGO on your offer. Or, promote product repurchases by incentivizing shoppers through bonuses. These strategies, among many others offered by the Ibotta Performance Network (IPN), can set your business apart from the competition and increase brand loyalty.
Trend #3: School lists and the in-store experience drive back-to-school shoppers
Influences on what savers decide to purchase
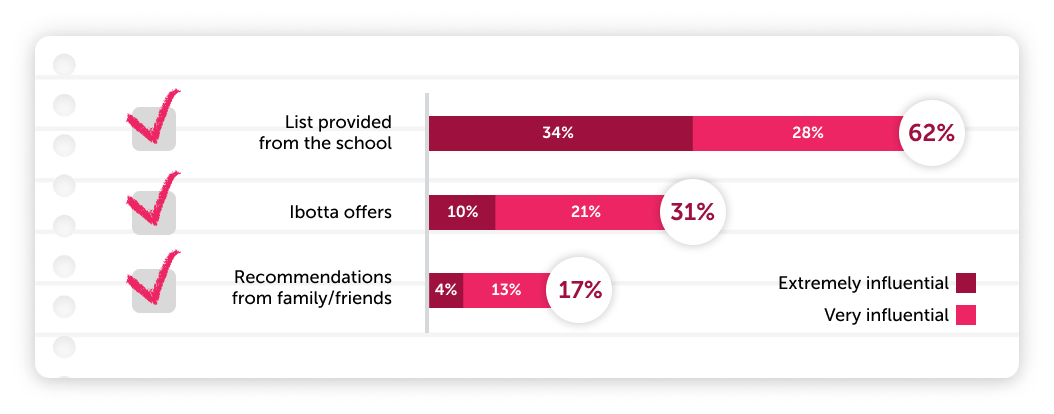
The back-to-school shoppers we surveyed said that the lists provided by their children’s schools have the biggest influence over their purchasing decisions. Sixty-two percent of respondents said school lists influence their purchases. Of that group, 34% said they’re extremely influential and 28% said they’re very influential. Categories like classroom essentials see a large lift in purchases during the peak back-to-school shopping window as they often appear on school supply lists. When looking at cleaning supplies and tools, food storage, and office supplies there is a major spike in the percentage of units moved for those categories compared to all categories we have data available for in June, July, and August.
Units moved in classroom essentials/total units moved for all categories
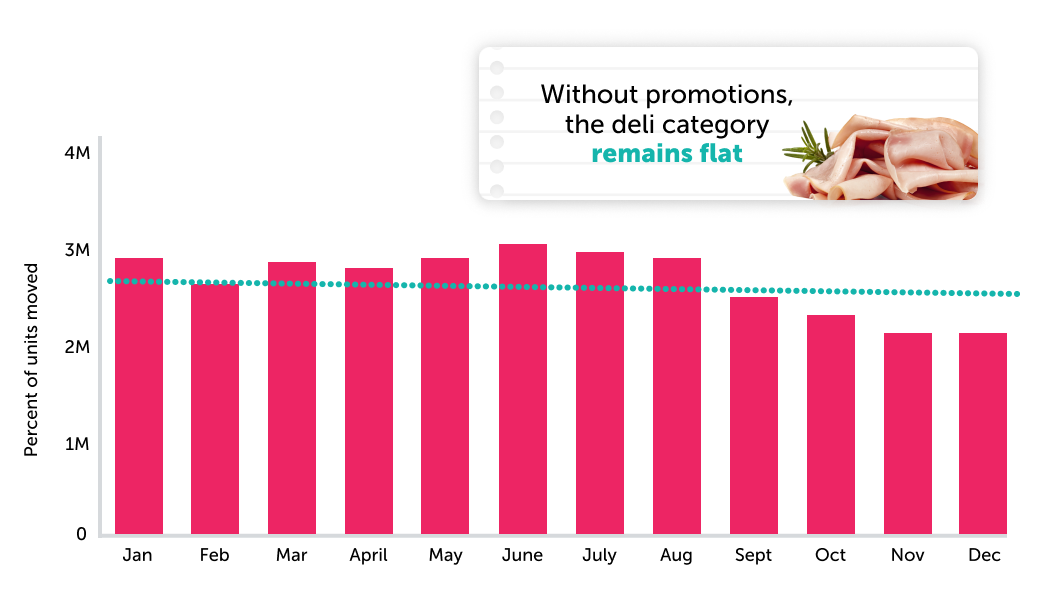
Although there are dramatic spikes in sales as supplies appear on school lists leading up to back to school, CPG categories may not see as clear of spikes. For example, our deli category, which includes meat from the deli counter as well as prepackaged options, remains relatively flat over the course of the year. Running digital promotions on items that often appear in kids’ lunch boxes can help drive incremental sales and make the most of an opportunity to win market share.
Deli category percent of units moved
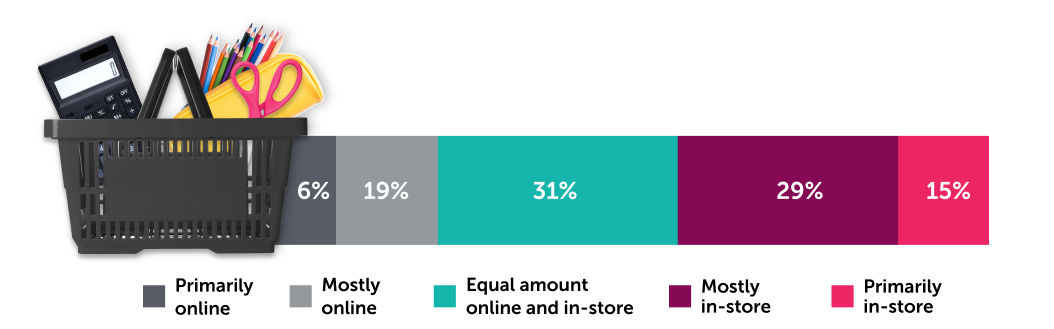
Another important shopping habit for brands to consider is where consumers will make their purchases. Back-to-school shoppers are nearly twice as likely to do the majority of their back-to-school shopping in-store, though most will be taking some degree of an omnichannel approach. When asked where they expect to complete their back-to-school purchases, 45% said mostly or primarily in-store while 25% said online. But, 34% said they will purchase an equal amount online and in-store. This makes both the in-store and hybrid shopping experiences critical for brands.
What channels Savers plan on utilizing for back-to-school shopping
How you can respond: There’s no doubt that school lists are a key to winning the back-to-school season. If your brand’s products are frequently on lists of back-to-school essentials, make sure your brand is the first choice by leveraging promotions and an omnichannel marketing strategy that keeps your brand front and center for shoppers. Retailers can access this type of content as well by leveraging digital rewards solutions like the IPN. We can ensure your retailer offers deals and discounts that consumers look for and connect the online and in-store experience to increase customer loyalty.
Trend #4: Shoppers seek deals and will trade down if they’re unavailable
School supplies (93%) and clothing (81%) are the top-two categories back-to-school shoppers expect to buy from this year. And almost all — 98% — of surveyed shoppers said they will be looking for deals in at least one category for back to school. This emphasizes the importance of providing promotions on popular back-to-school categories this season.
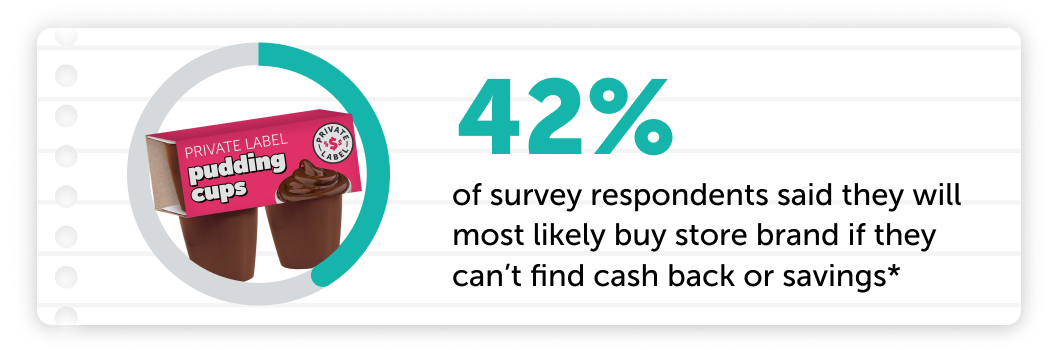
In the absence of deals, shoppers are most likely to trade down. If a deal is unavailable, 44% said they will purchase a lower-priced brand name and 42% said they will switch to a private label in at least one category.
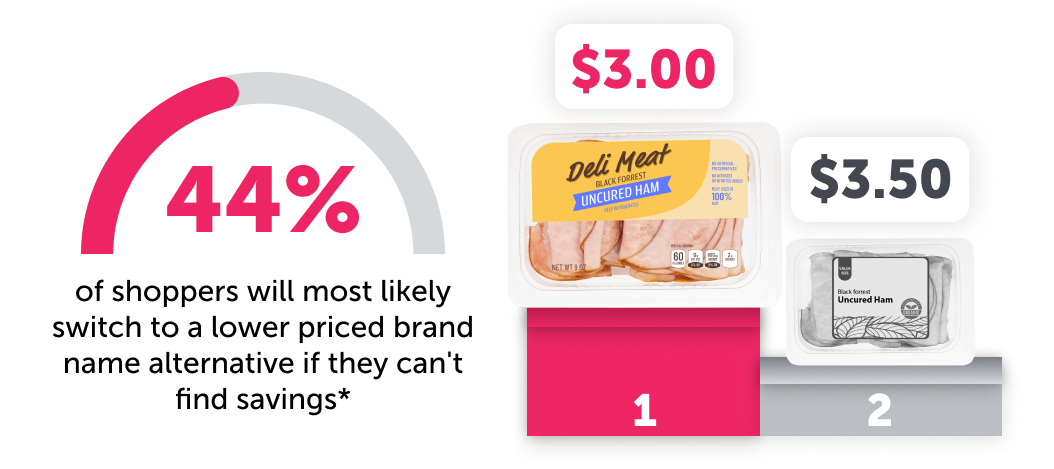
*in at least one category
Our data shows some private-label switching occurred last year in school supply products. While units moved in the coloring category decreased by 18.4% in branded products from August of 2023 to 2024, it grew by 39% for private label. Similarly, painting saw a 36.4% decrease in branded units moved in August year over year but a 13.3% increase in private label. These results show that large shifts toward private-label products can occur, especially when deals are unavailable to shoppers.
*in at least one category
When it comes to CPG, August is the second highest driver of branded units moved in the snacks, cookies, and chips categories but is the fifth lowest driver of private label units moved. Additionally, we see a 7.9% increase from July to August 2024 for branded units moved but a 6% decrease month over month for private label. This indicates that back-to-school shoppers are likely prioritizing branded products that their kids prefer to start the back to school season. CPG brands should utilize digital promotions to combat the competition when shoppers have a higher propensity to buy branded products.
Units moved in snack, cookies, and chips categories in 2024
.png)
How you can respond: As brand loyalty is up for grabs during back to school, brands can take a similar approach as General Mills. When they leveraged the IPN during the 2023 back-to-school season, they saw an 87% incremental sales lift on one of their campaigns. Of those redeemers, 47.6% were new to the brand and 29.2% had exclusively purchased from General Mills’ competitors in the two weeks before the campaign. The IPN has only improved our offering since then to set you up for even more success. Our innovations in real-time incremental sales measurement enable brands to optimize campaigns while they’re occurring. Combined with our 200M+ reach, brands can have confidence the IPN will generate impactful campaigns throughout the back-to-school season and beyond.
Get the study guide
Want a crash course on everything you’ve learned from Back to School 101? Access the essential notes and prepare for the season. Plus, contact us to learn more about how the IPN can help you win back to school.
Check it out