March 9, 2023
As brand leaders look to maximize incremental sales during the summer months, pay-per-sale promotional strategies can accelerate purchase volume while incentivizing shoppers to trade up from private label during times of economic uncertainty.
Inflation is pressuring brands and retailers to prioritize loyalty initiatives in 2023. A recent merchant affinity survey revealed the leading driver of improved loyalty was Low Prices (77.2%) followed by Promotions and Discounts (52.3%). (Source: PYMNTS.)
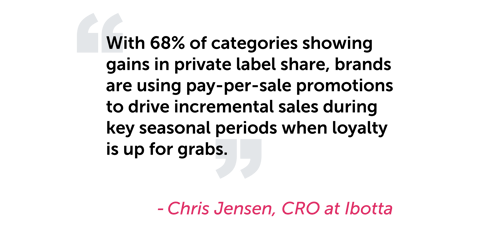
A majority of categories across a 12 month period from early 2022 – 2023 experienced significant movement between private label and branded products. Of these categories, 68% showed gains in private label share.
.png?width=570&height=401&name=Summer%20Kickoff%20Blog%20Graphics_additions%20(1).png)
On a category-by-category basis, recurring low and high points of historical purchase volumes can serve as a reliable guide for brands. Knowing when purchasing surges are to be expected enables them to get ahead of competitors by, for example, launching promotions further ahead of peak seasonal spikes.
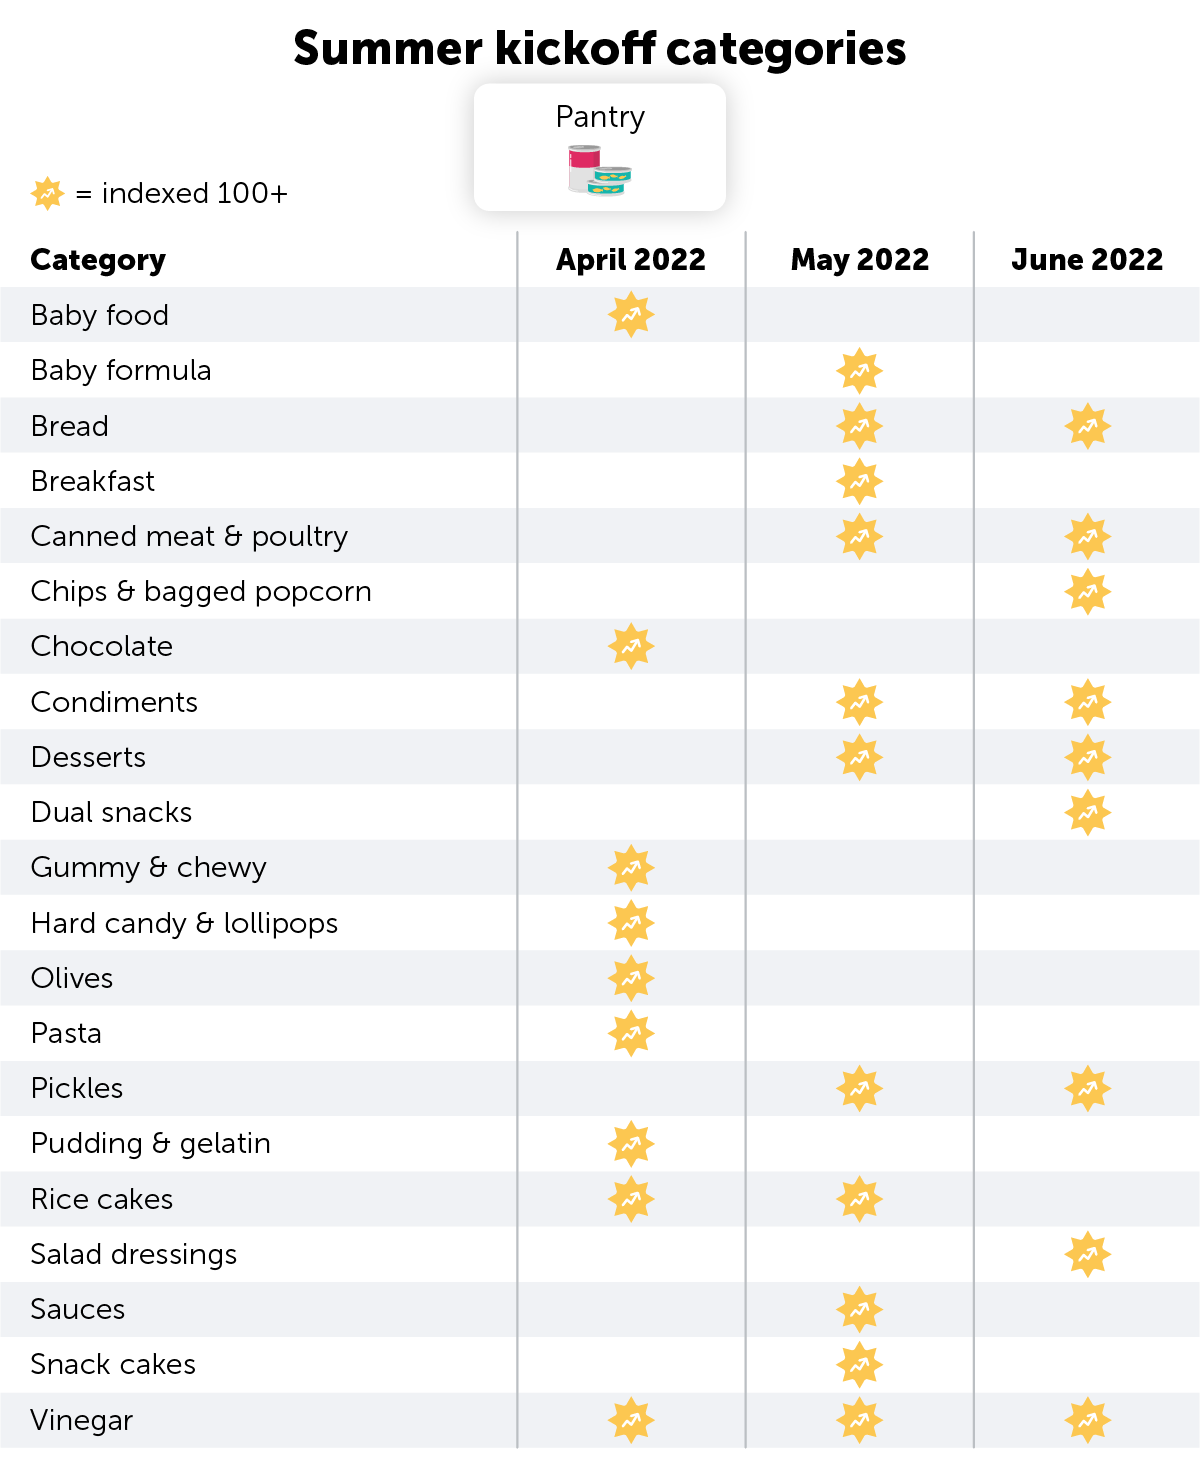
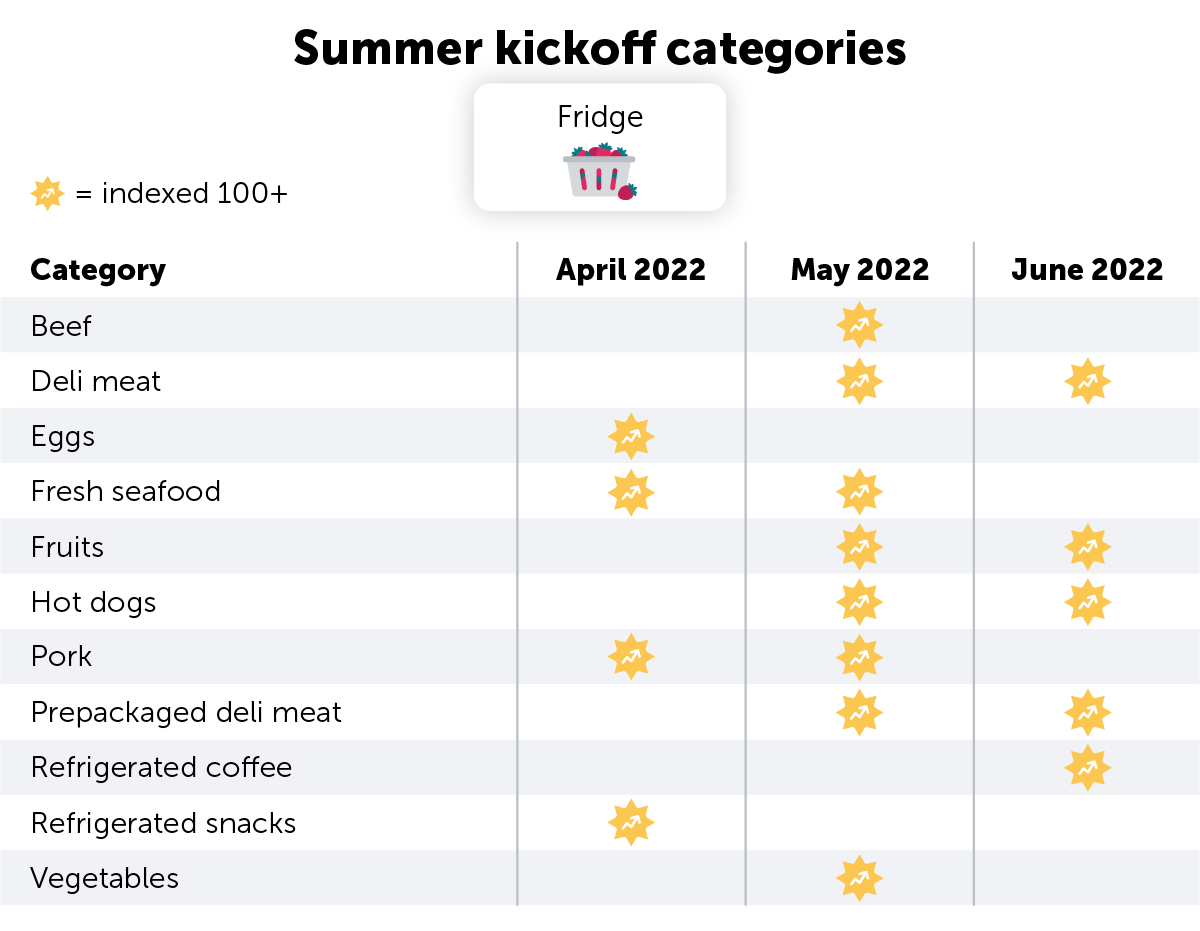
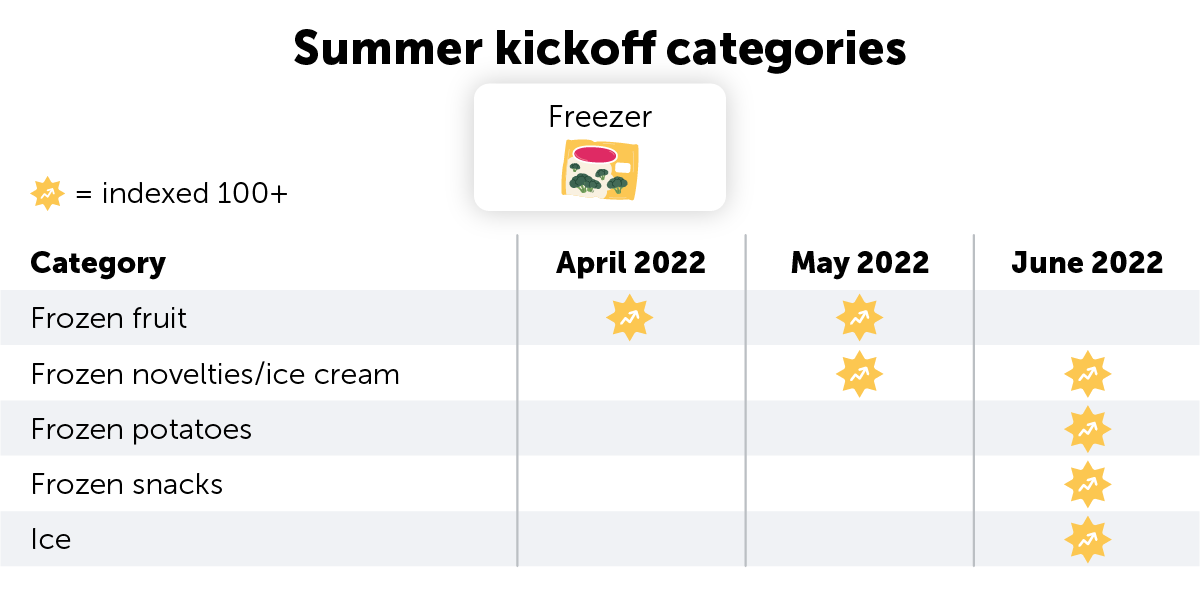
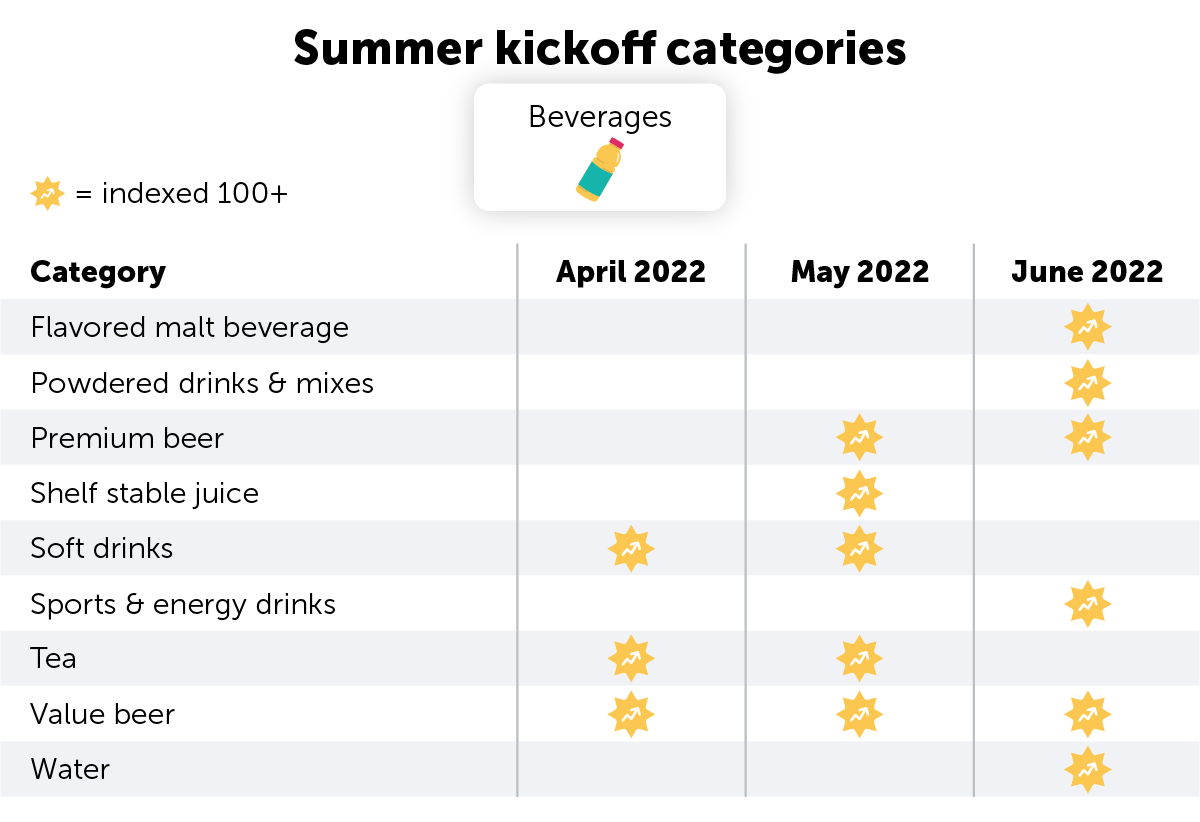
Expanded lists below highlight key categories heating up for Summer Kickoff based on where they indexed highest in purchase volume during the months of April, May, and June 2022.
1. Use the tables below to identify categories that over index in purchase volume during Summer Kickoff months and run pay-per-sale offers to combat price sensitivities and shoppers trading down.
2. Gain deeper insights: private label impact in your category, the best time to launch seasonal campaigns, tailored recommendations to maximize market share — by contacting your Ibotta representative.
Get insights for your category
Jump ahead to:
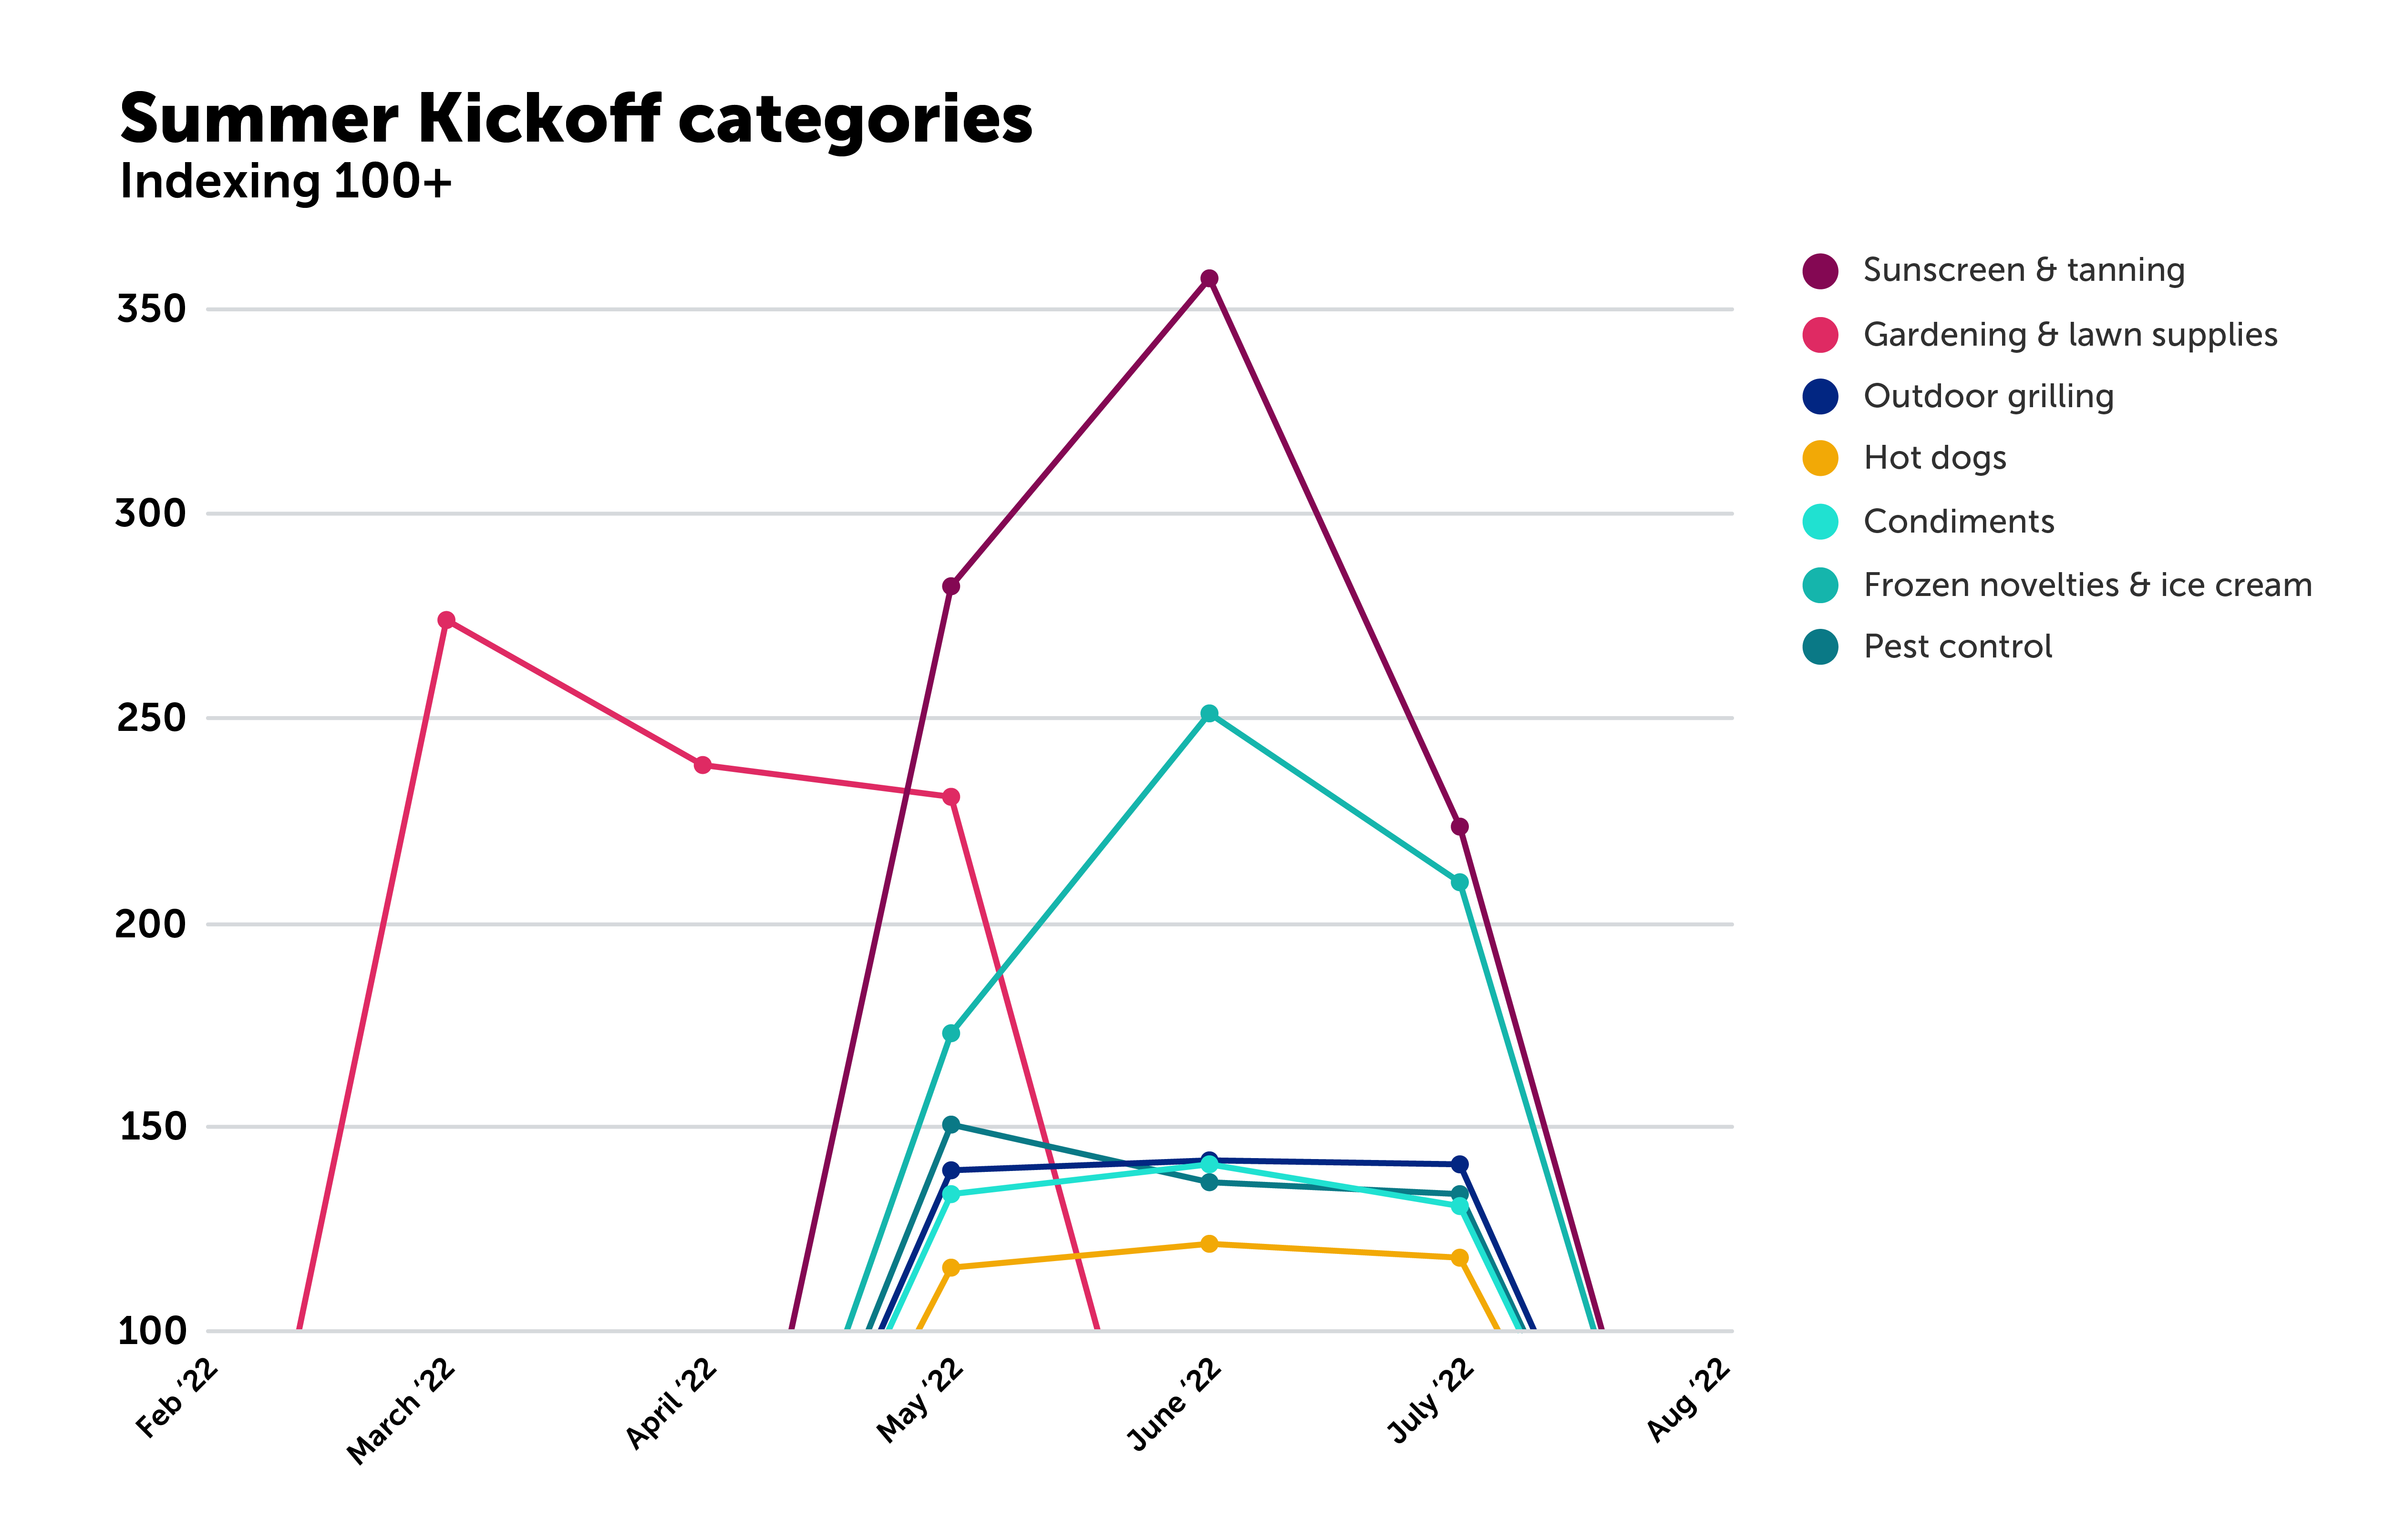
Summer-essential-SKUs from sunscreen & tanning to outdoor grilling, hot dogs, condiments, frozen novelties and ice cream, and even pest control all made their initial 2022 appearances on the winner’s list in May. As consumers prepare for outdoor festivities, pre-summer spending can be expected around this time annually. The gardening & lawn supplies category typically gains traction earlier, as seen indexing above 100 in March 2022.
Food & Beverage
Pantry
The table shows during which month(s) each category listed experienced a purchasing surge in 2022. Brands can identify purchasing surges and build their promotional campaigns around them.
Category Highlight: Bread
Bread sales follow a clear seasonal trend with a steep surge beginning in either very late April or early May and continuing until either very late June or early July. The end of this surge also typically represents the annual high point. Given the shorter shelf life of bread, brands may be well advised to launch promotional campaigns before this surge begins.
.png?width=1073&height=649&name=Summer%20Kickoff%20Blog%20Graphics_4%20Year%20Seasonal%20Trends_Bread%20(1).png)
What goes best with bread? Whether it’s condiments, sauces, pickles — beef, deli meat, hot dogs (see these and other fridge items below) — who doesn’t love their favorite breads, proteins, and add ons served up with promotional cash back offers?
Brands get more out of a purchasing surge by running multi-brand activations around complimentary categories.
Fridge
The table shows during which month(s) each category listed experienced a purchasing surge in 2022. Brands can identify purchasing surges and build their promotional campaigns around them.
Category Highlight: Hot Dogs
The high frequency distribution of hot dogs’ seasonality might seem tricky to navigate; however, it may be helpful seeing that the annual high point typically occurs near Memorial Day. Brands maximize seasonal incrementality by launching promotions further ahead of peak seasonal spikes.
.png?width=1073&height=652&name=Summer%20Kickoff%20Blog%20Graphics_4%20Year%20Seasonal%20Trends_Hot%20dogs%20(1).png)
Freezer
The table shows during which month(s) each category listed experienced a purchasing surge in 2022. Brands can identify purchasing surges and build their promotional campaigns around them.
Category Highlight: Frozen Novelties/Ice Cream
Frozen novelties/ice cream sales begin a net rise in January, building to a high point in late June, close to Father’s Day. For Summer Kickoff planning, brands may want to capitalize on the slight trough in late April, running promotional campaigns into the two-month-long rise..png?width=1073&height=668&name=Summer%20Kickoff%20Blog%20Graphics_4%20Year%20Seasonal%20Trends_Frozen%20novelties%20%26%20ice%20cream%20(1).png)
Beverage
The table shows during which month(s) each category listed experienced a purchasing surge in 2022. Brands can identify purchasing surges and build their promotional campaigns around them.
Category Highlight: Soft Drinks
The tall spike for soft drinks sales occurs close to Independence Day, July 4. That purchasing surge begins early June, and the entire month will be an ideal timeframe for promotional campaigns.
.png?width=1073&height=780&name=Summer%20Kickoff%20Blog%20Graphics_4%20Year%20Seasonal%20Trends_Soft%20drinks%20(1).png)
Apparel
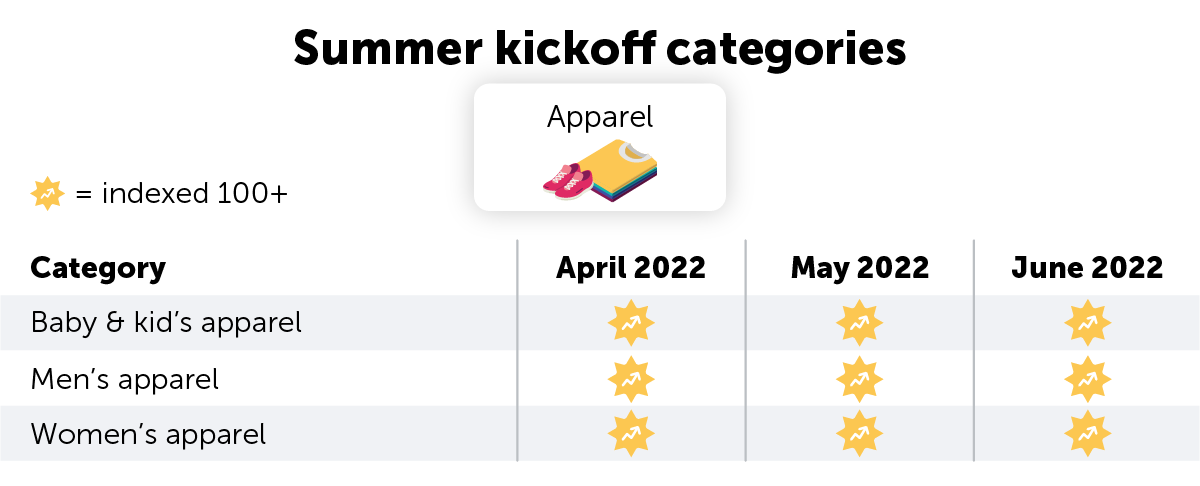
The table shows during which month(s) each category listed experienced a purchasing surge in 2022. Brands can identify purchasing surges and build their promotional campaigns around them.
Health & Beauty
The table shows during which month(s) each category listed experienced a purchasing surge in 2022. Brands can identify purchasing surges and build their promotional campaigns around them.
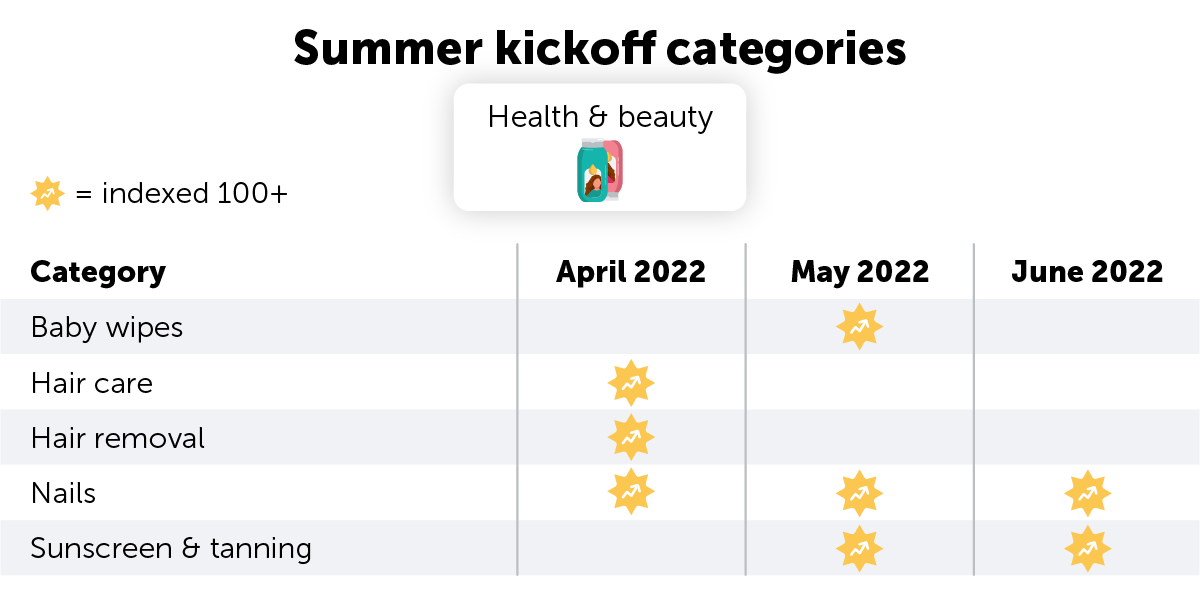
Category Highlight: Sunscreen & Tanning
Sunscreen & tanning sees its second lowest point each year at the end of April or beginning of May — this is precisely when the steepest net positive purchasing surge begins. Brands may want to get ahead of competitors, running campaigns in April while aggregate sales are low.
.png?width=1073&height=685&name=Summer%20Kickoff%20Blog%20Graphics_4%20Year%20Seasonal%20Trends_Sunscreen%20and%20tanning%20(1).png)
Household Goods & OTC
The table shows during which month(s) each category listed experienced a purchasing surge in 2022. Brands can identify purchasing surges and build their promotional campaigns around them.
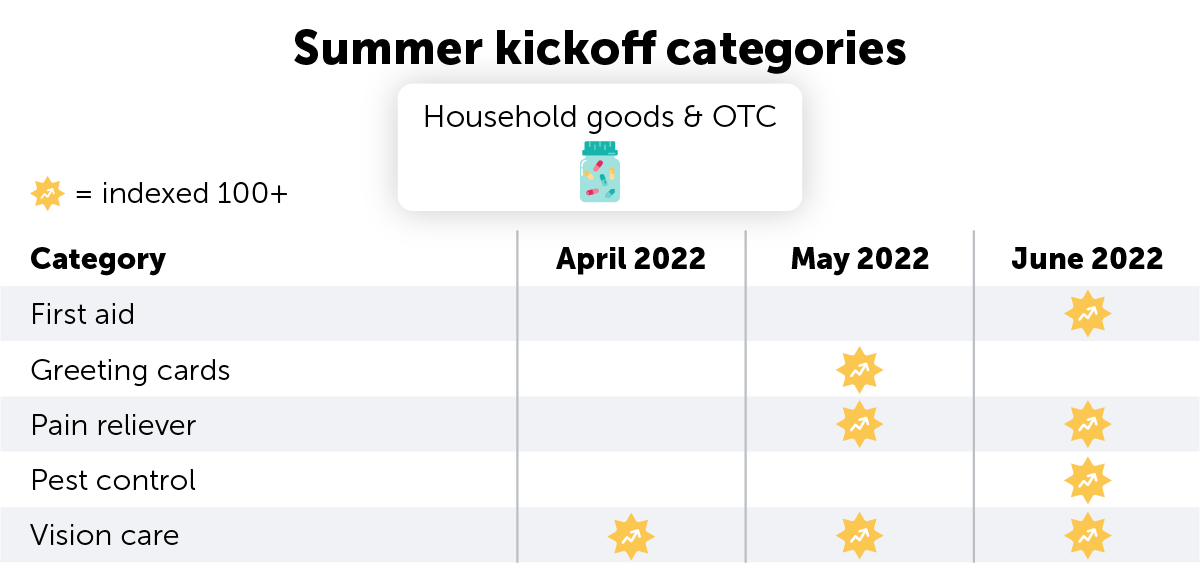
Outdoor Living
The table shows during which month(s) each category listed experienced a purchasing surge in 2022. Brands can identify purchasing surges and build their promotional campaigns around them.
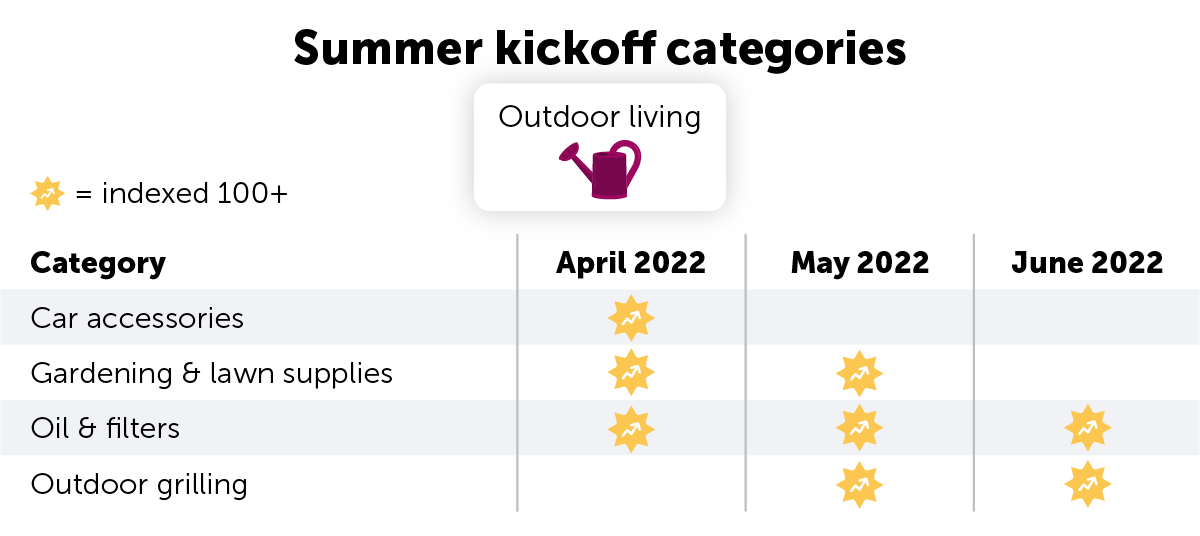
Recap & Takeaways
Understanding purchasing surges on a category-by-category basis during key seasons enables brands to strategically build marketing and promotional campaigns that drive shoppers to their product at the right time.
Based on the data above (and a sprinkle of common sense) make sure to keep the following holidays in mind when building your 2023 Summer Kickoff promotional strategy.
- Easter - Sunday, April 9
- Cinco de Mayo - Friday, May 5
- Mother’s Day - Sunday, May 14
- Memorial Day - Monday, May 30
- Father’s Day - Sunday, June 18
- Juneteenth - Monday, June 19
- Independence Day - Tuesday, July 4
|
Connect with your Ibotta rep to dive deeper into category-specific historical data and plan out robust promotional campaigns to drive incremental sales and win market share. |
Planning for a different season? Check out the Category Pacesetters tool to see which categories over index for any month of the year. |
Stay tuned for key seasonal guides to come: Back-to-School, Holiday 2023, New Year’s Resolutions. |
Brands, retailers, and advertisers who join the IPN gain access to deep insights and proprietary data to identify new opportunities for effective promotional strategies — inquire here to learn more.
![]()
Achieve your brand goals
Which metrics are most important for your brand? Get in touch to explore possibilities with the Ibotta Performance Network.
