November 9, 2023
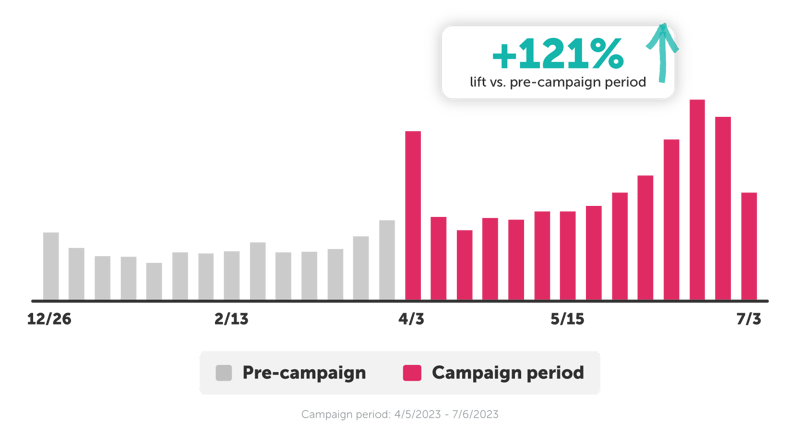
The IPN delivers significant volume lift
When activating on the IPN, this toy brand drove a +121% lift in daily sales vs. pre-campaign period.
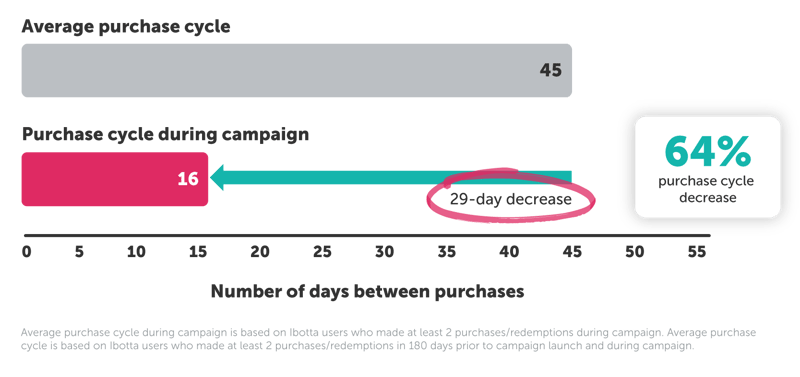
Accelerating the purchase cycle
This toy brand successfully shortened the purchase cycle by 64%.
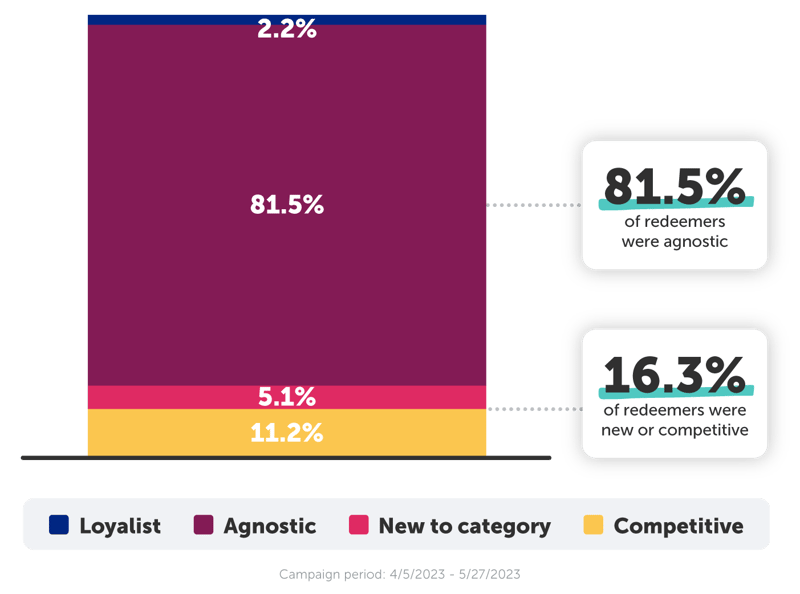
Driving results with the right shoppers
The IPN campaign for this toy brand converted 16.3% new and competitive shoppers and 81.5% were agnostic. Existing loyalists accounted for just 2.2% of redeemers.
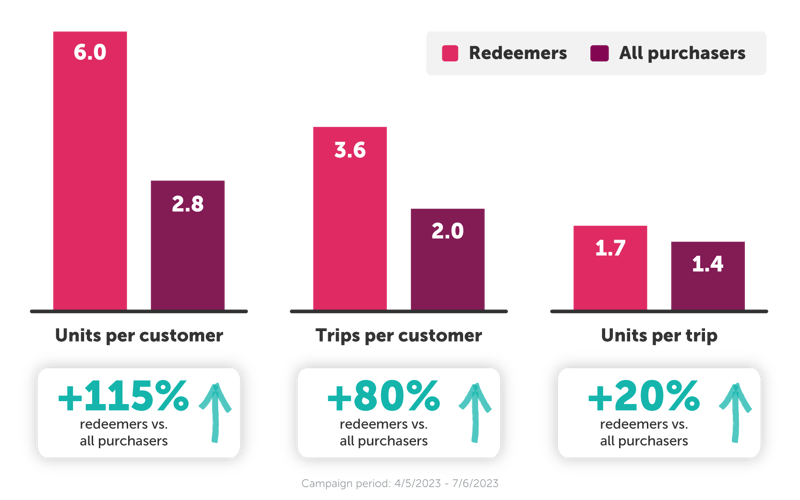
Converting more valuable shoppers
IPN offer redeemers of this toy brand were highly valuable, resulting in a +115% increase in units sold per customer and an +80% increase in store trips vs. all purchasers.
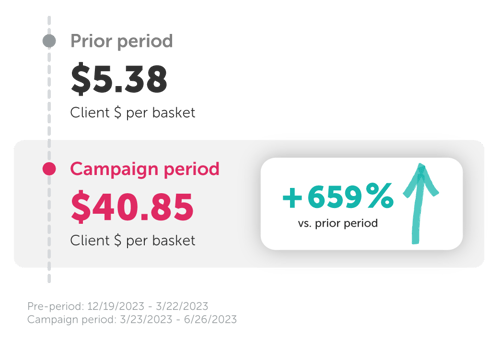
Maximizing basket size
This toy brand saw a +659% lift in basket size during the IPN campaign vs. pre-campaign period.
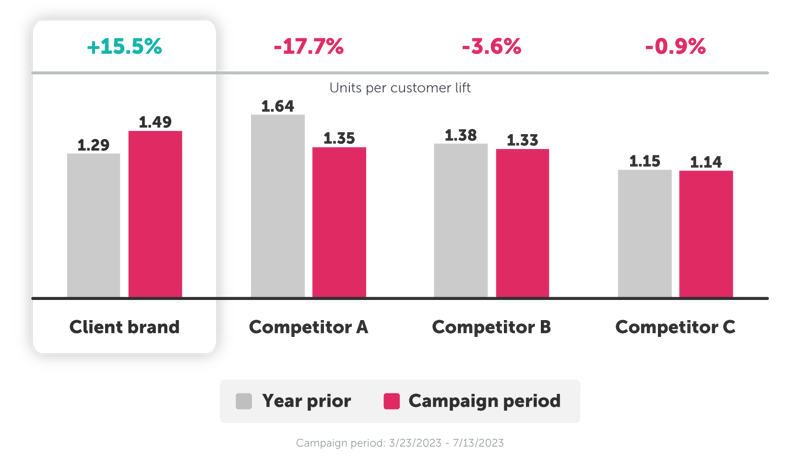
Achieving sales volume growth YoY
This toy brand experienced a +15.5% YoY increase in units sold per customer during their campaign, while major competitors saw a decline in the same period.
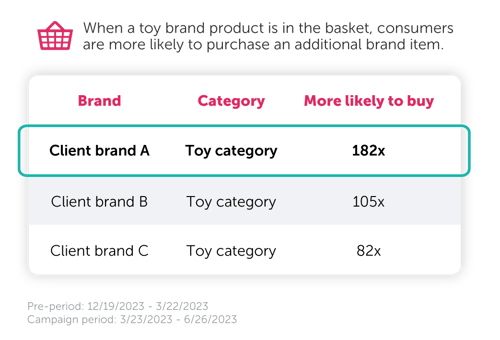
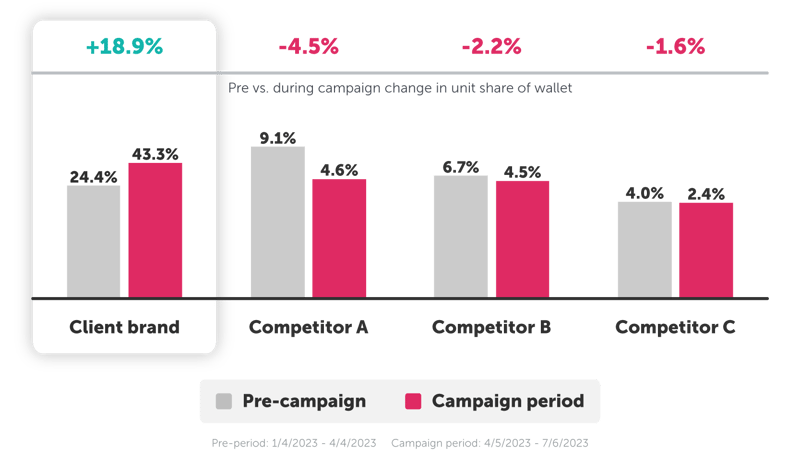
Growth in share of wallet
During the IPN campaign, 43% of toy purchases by redeemers were dedicated to the client's brand, marking an impressive 18.9% growth in their share of wallet vs. pre-campaign period.
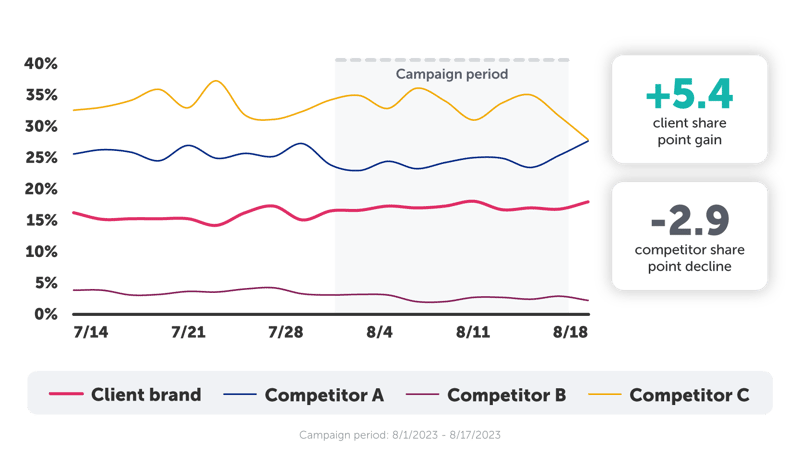
Capturing market share
This toy brand captured a +5.4 point gain in purchase share by week while competitor share declined -2.9 points.
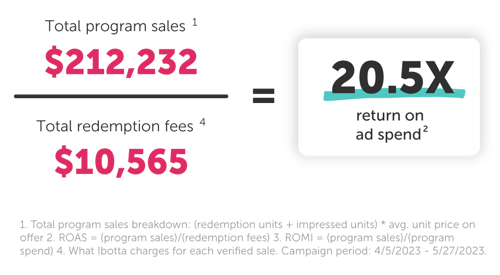
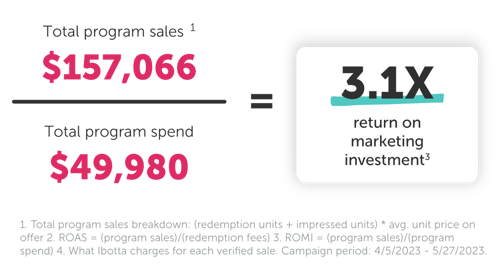
ROAS and ROMI analysis
This toy brand drove a 20.5X return on ad spend (ROAS) and 3.1X return on marketing investment (ROMI) during the IPN campaign.
TOY CATEGORY INSIGHTS
Toy buyers are feeling economic pressure
35% of toy buyers believe inflation is significantly impacting their ability to pay monthly bills, with 45% shopping at dollar or discount stores in response.
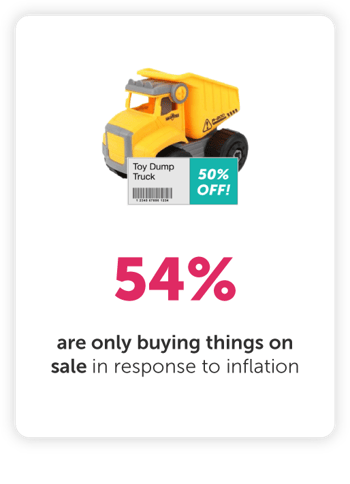
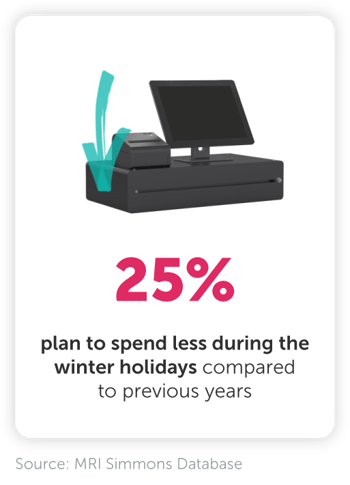
Economic pressures will likely impact holiday shopping spend
While 25% of shoppers plan to spend less this year, 54% are only buying toy items offered at a discounted price.
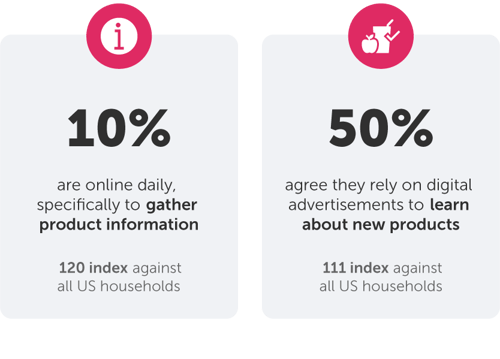
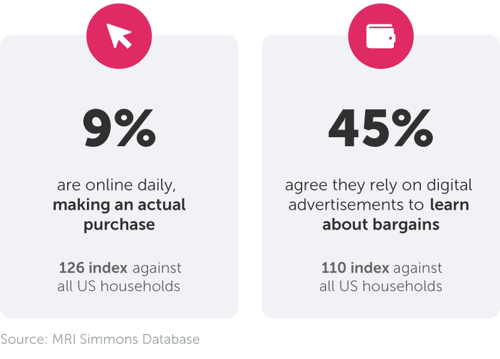
Toy buyers are engaging digitally & seeking deals
Roughly half of toy buyers rely on digital ads for new product discovery and for finding bargains, while every day, 10% seek products online and 9% make an actual purchase.
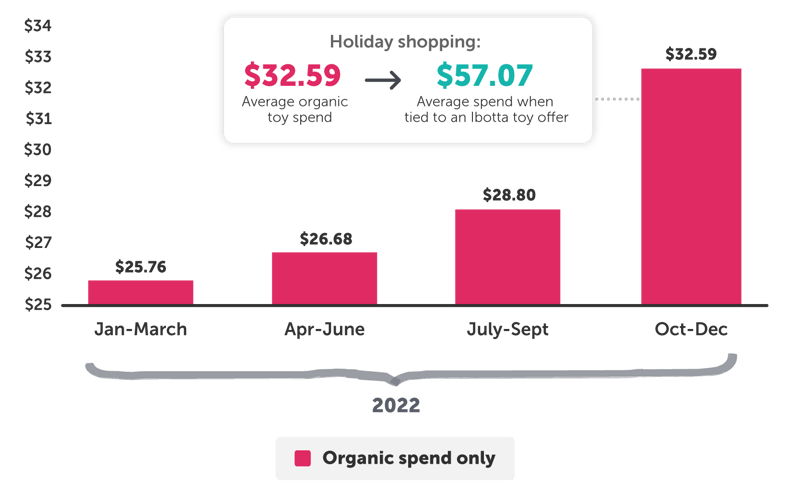
Digital offers’ impact on toy spend (Q4)
Toy shoppers organically spent $32.59 on average in Q4. When a purchase was tied to an Ibotta toy offer, that figure rose to $57.07.
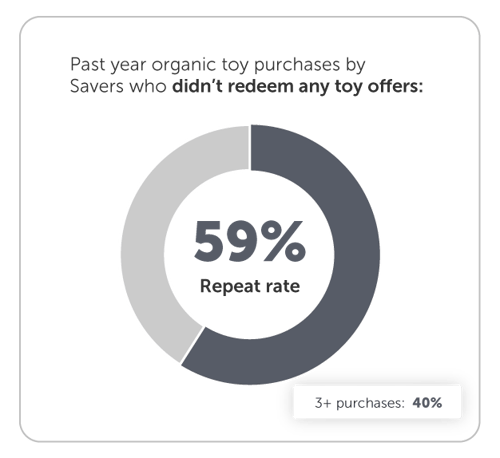
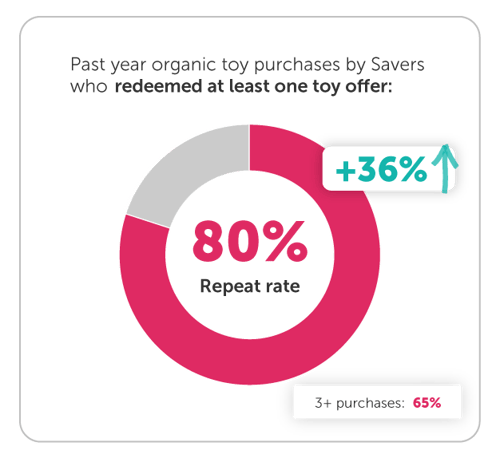
Digital offers’ impact on repeat purchases
Those who redeem toy offers on Ibotta are more likely to make repeat organic purchases.
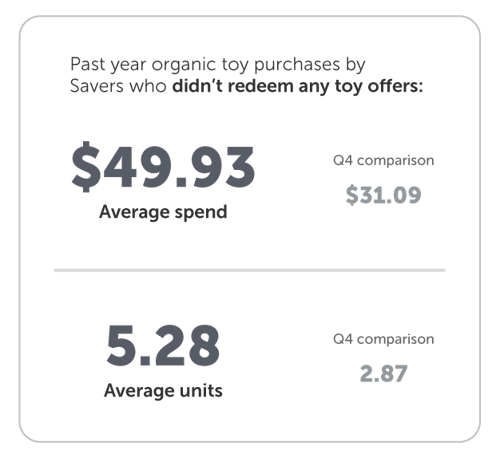
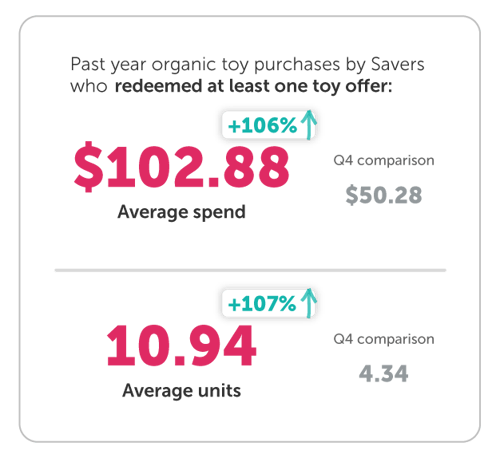
Digital offers’ impact on toy spend & unit volume (throughout the year)
Toy shoppers who didn’t redeem any offers organically spent $49.93 for 5.28 units on average. When a shopper had redeemed at least one Ibotta toy offer, those figures rose to $102.88 and 10.94 units.
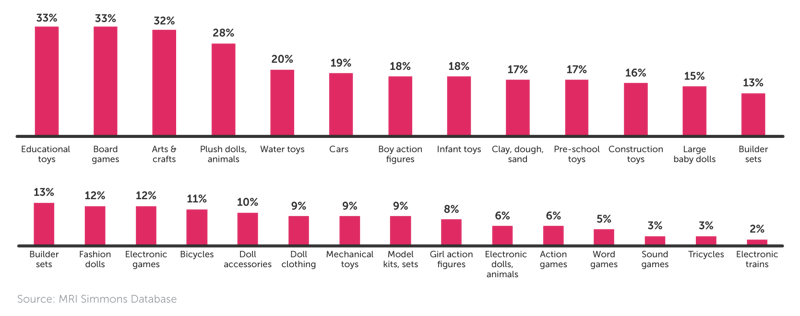
Toy popularity by type
Educational toys, board games, and arts/crafts have been the most popular types of toys purchased.
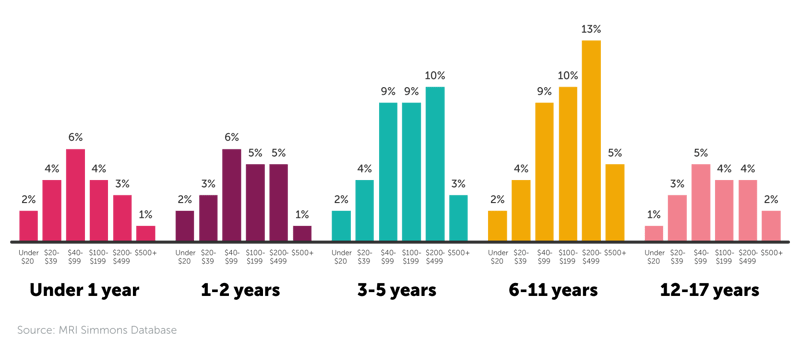
Toy product spend by age
Spending on toys and games appears to reach a peak for those with children ages 6 – 11.
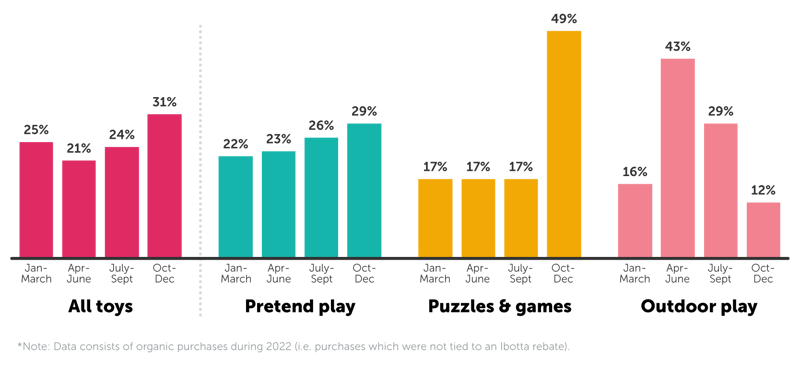
Share of organic toy sales by quarter
Puzzles, games, and outdoor play are highly seasonal. In contrast, pretend play sees a gradual increase throughout the year, similar to the overall category trend.
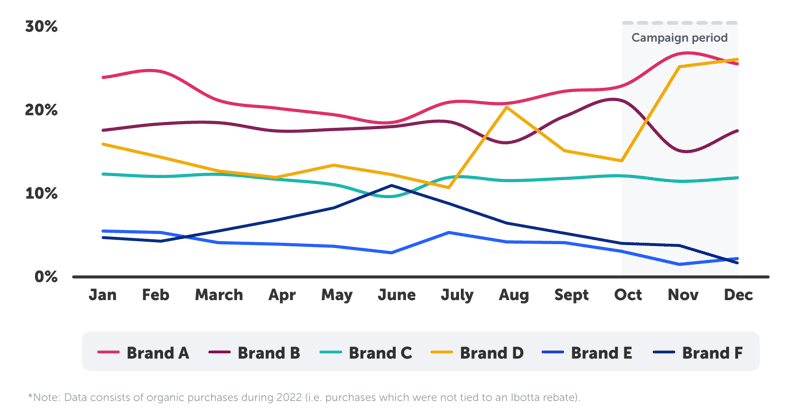
The toy category is saturated and competitive
In Q4 of 2022, Brand A and Brand D accounted for roughly half of the market share of only organic purchases.
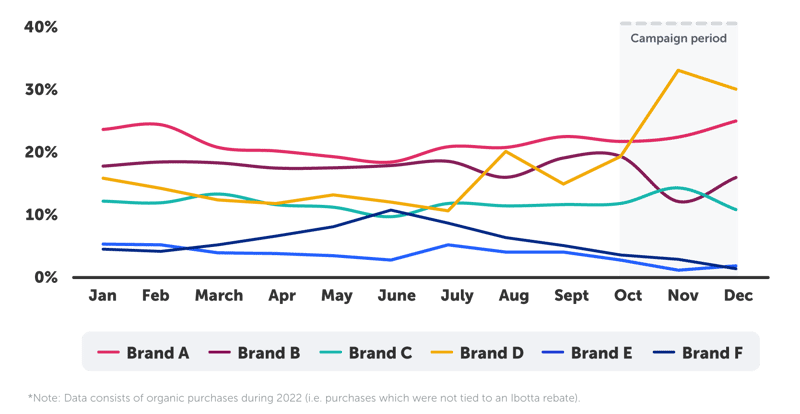
Ibotta promotions help drive increased market share
Brand D seized control of the toy category, dominating in Q4 with Ibotta promotions running.
![]()
Achieve your brand goals
Which metrics are most important for your brand? Get in touch to explore possibilities with the Ibotta Performance Network.