March 7, 2025
The economic landscape of recent years has presented a complex and ever-shifting challenge for both consumers and marketers. As inflation surged and economic uncertainties loomed, consumers were forced to adapt their spending behaviors, seeking ways to stretch their budgets further. Marketers, in turn, grappled with the task of navigating these changes, striving to understand the evolving needs and preferences of their target audience.
Against this backdrop, our comprehensive survey of over 5,000 grocery shoppers and 400 CPG marketers aims to shed light on the current state of spend in the U.S. grocery sector. By capturing a 360-degree view of spending habits and marketing strategies, we seek to uncover the significant shifts that have occurred over the past year. Our exploration delves into the many factors and nuances that shape consumer behavior as well as marketers' responses in today's dynamic economic climate.
Whether you’re a brand, retailer, or publisher in the grocery space, this research will help you better understand today’s consumer, more effectively tailor your marketing strategies, and prepare for the future with confidence.
Economic outlook & how it’s changed since 2023
Our perceptions of and outlook on the economy have a tremendous impact on how and where we choose to spend our money, both as marketers and consumers. This has been especially true in recent years with rising costs and inflation driving many to find new and creative ways to stretch their budgets further. And while inflation is beginning to cool and the economy is feeling a bit more stable, consumers in particular are still feeling the pinch.
Consumer perceptions of the economy
The consumers we surveyed reported a slight improvement in economic outlook this year, with 55% having a negative perception of current economic conditions compared to 58% in 2023. However, many consumers remain cautious: Positive perceptions of the economy rose by only 1% year over year.
Yet despite consumers’ more pessimistic outlooks on the economy last year, 51% believed they would be better off in 12 months. But the reality of their situation in 2024 hasn’t lived up to those expectations. When asked this year, only 34% say they are better off now than they were at this point in 2023.
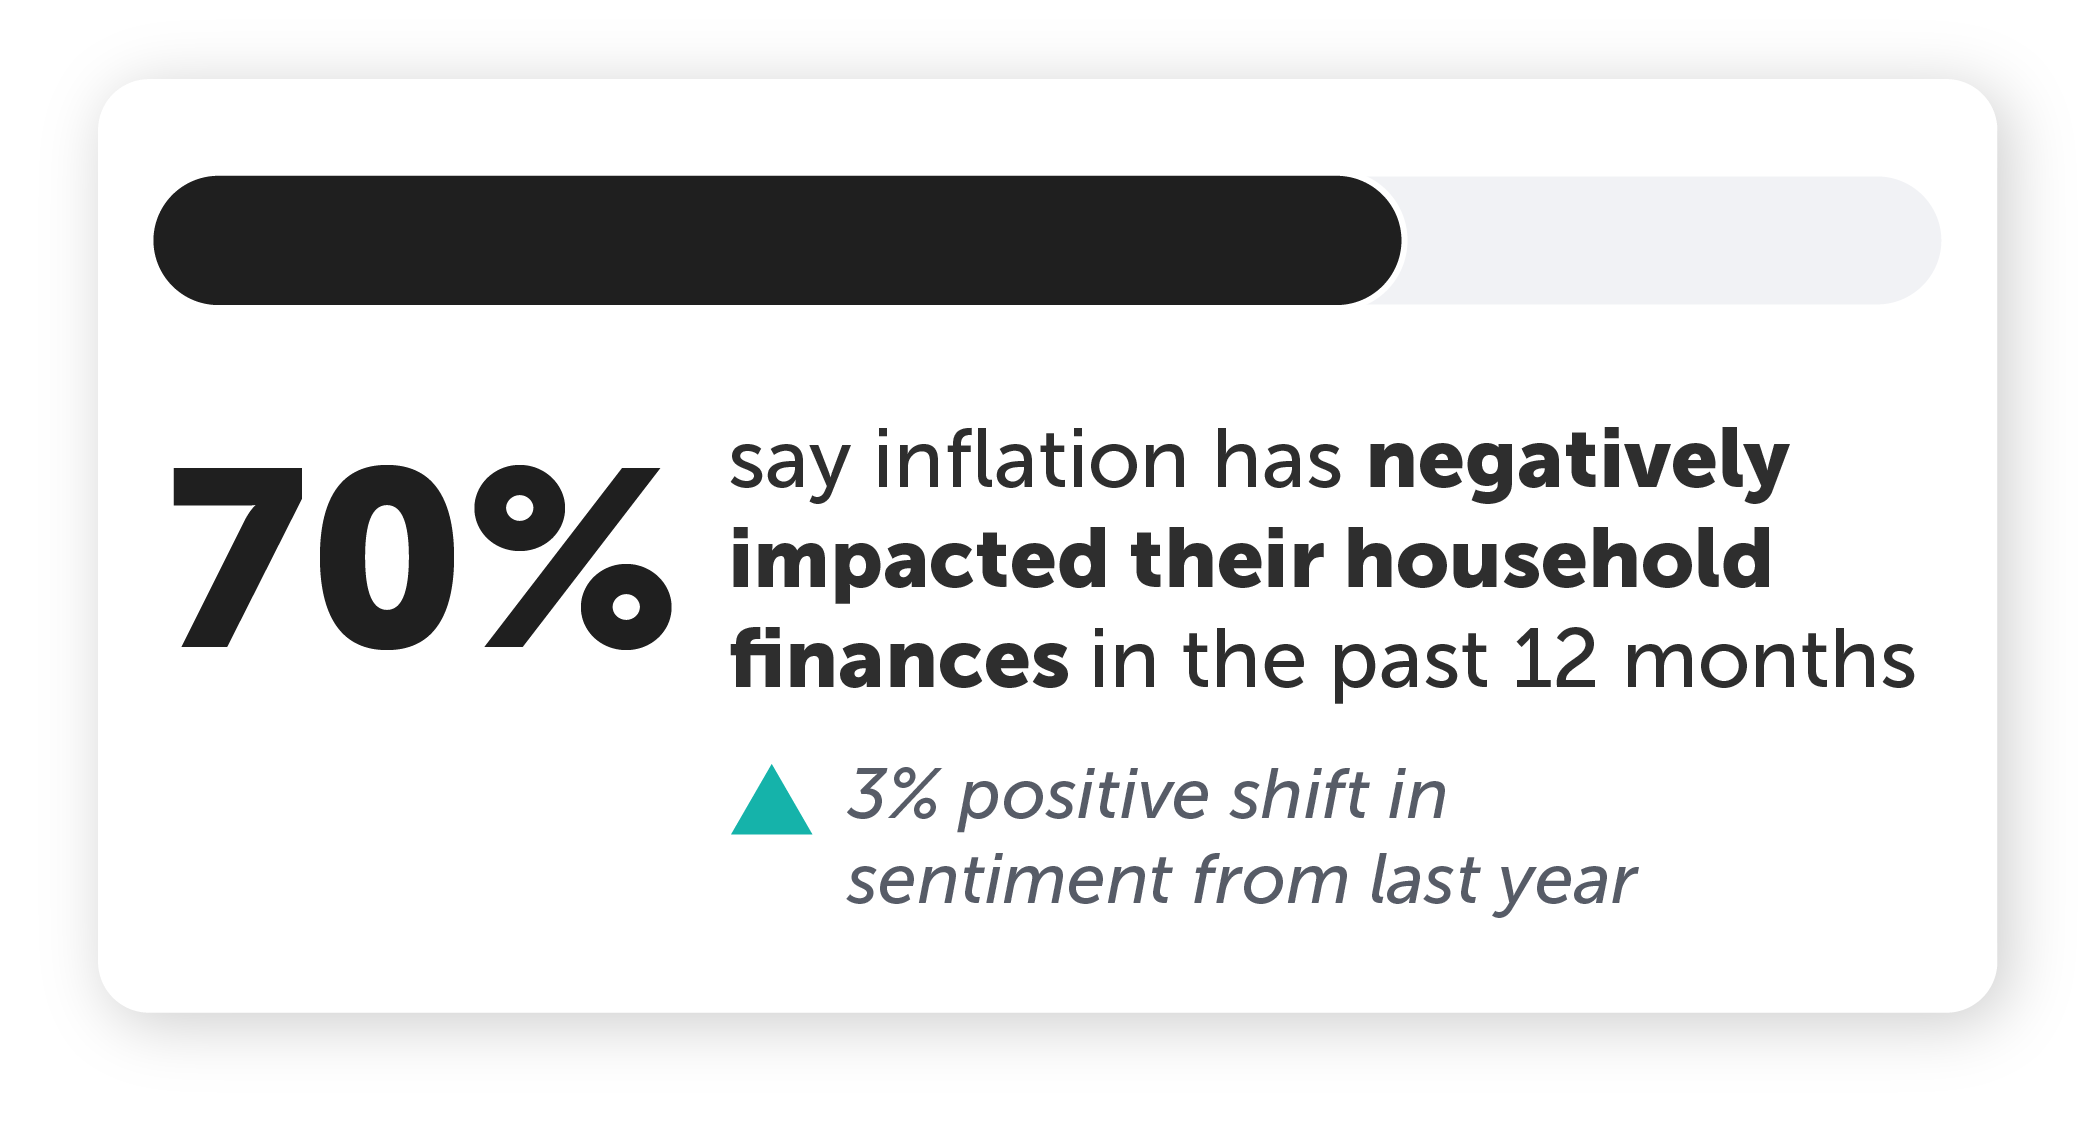
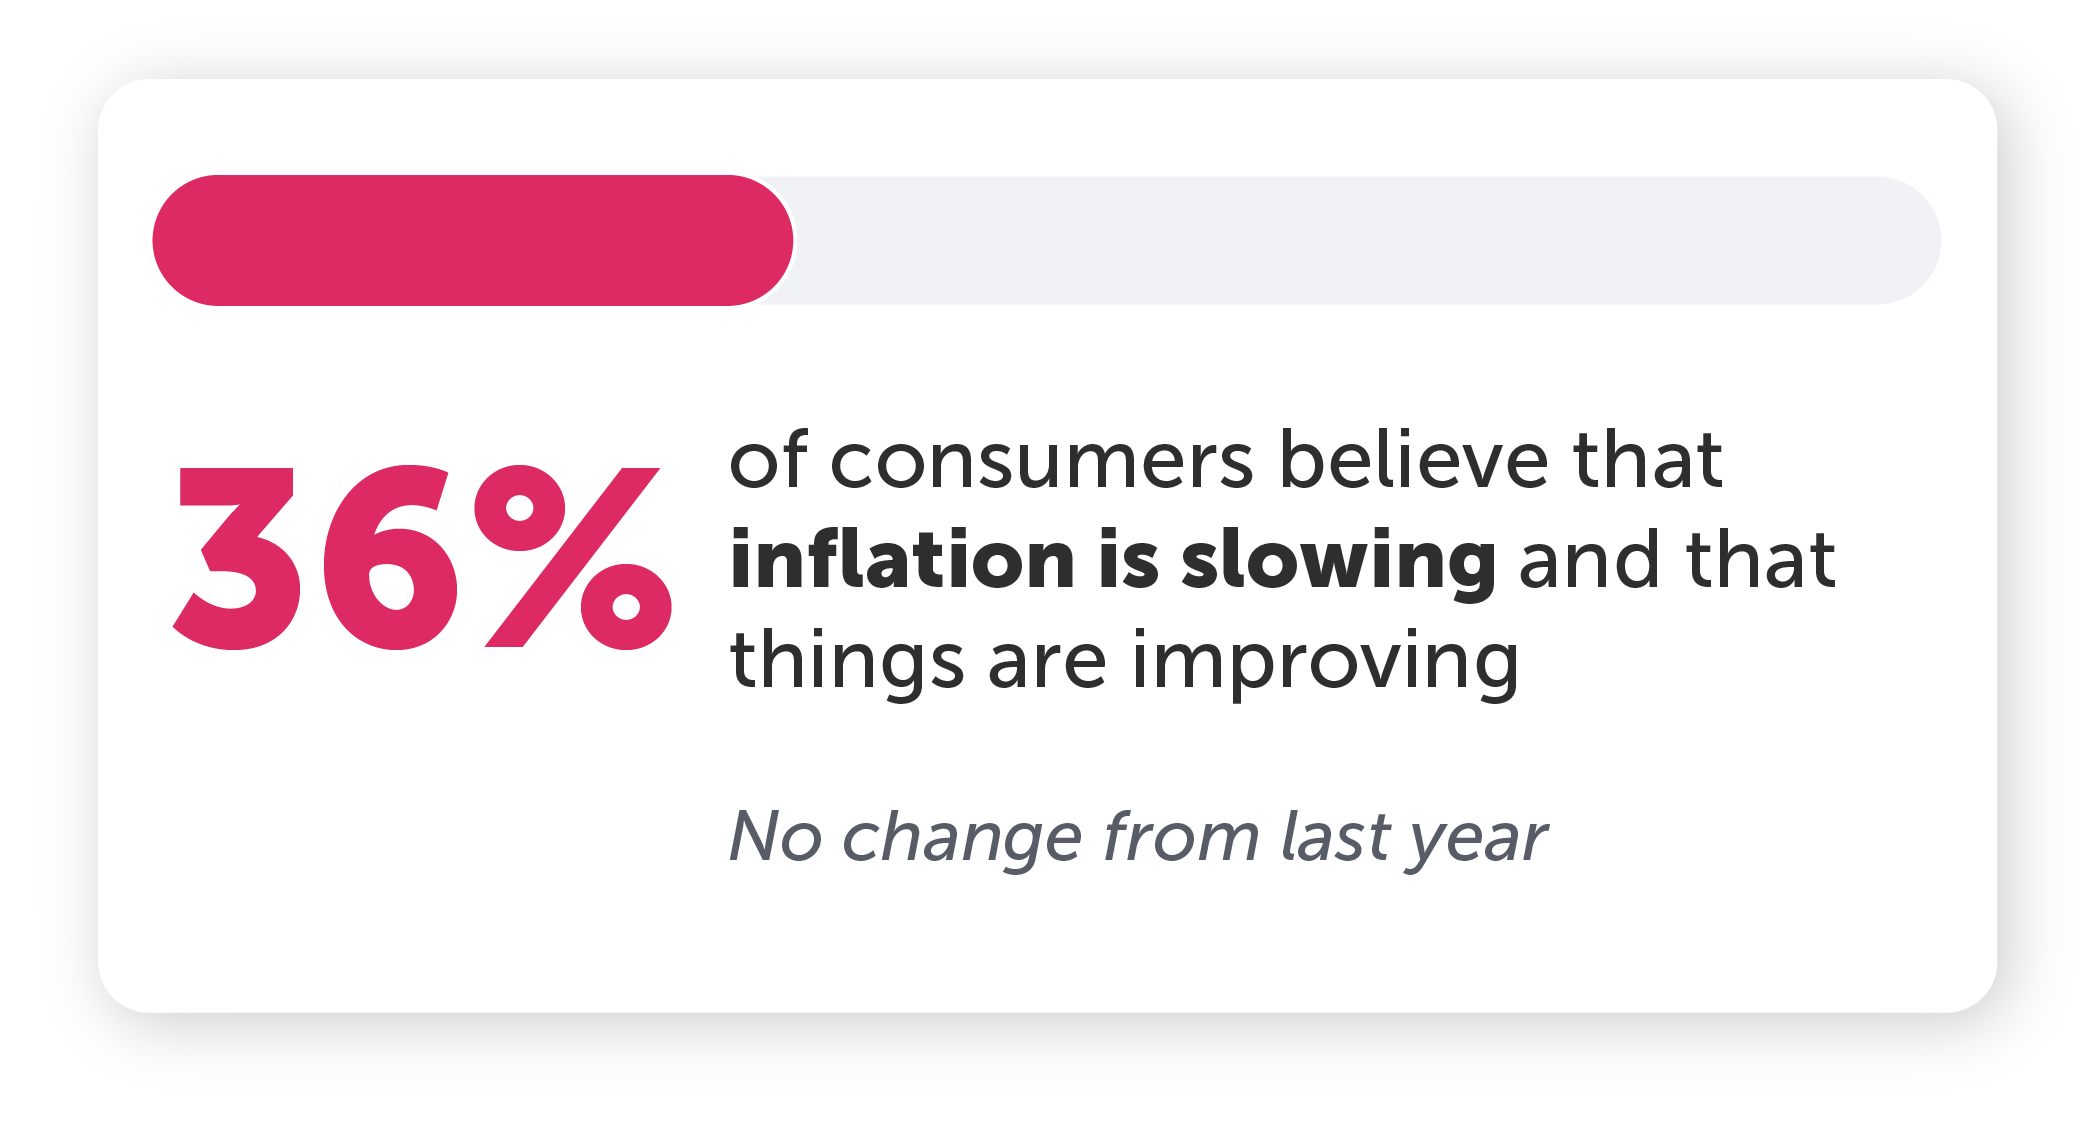
These unmet financial expectations may be fueling variability when it comes to the perception of inflation today — as well as uncertainty about its future trajectory. Only 36% of consumers believe inflation is slowing or that things are improving. And despite reporting a reduced personal impact from inflation — down from 73% to 70% in 2024 — it continues to affect a large majority of consumers.
Marketers perceptions of the economy
Marketers, on the other hand, have a slightly more optimistic view of the economy in 2024. Positive perceptions of current economic conditions rose 11% year over year — but they also grew more polarized. In addition to the notable increase in positive outlooks, negative perceptions grew by 7%, shrinking the middle ground to only 13%.
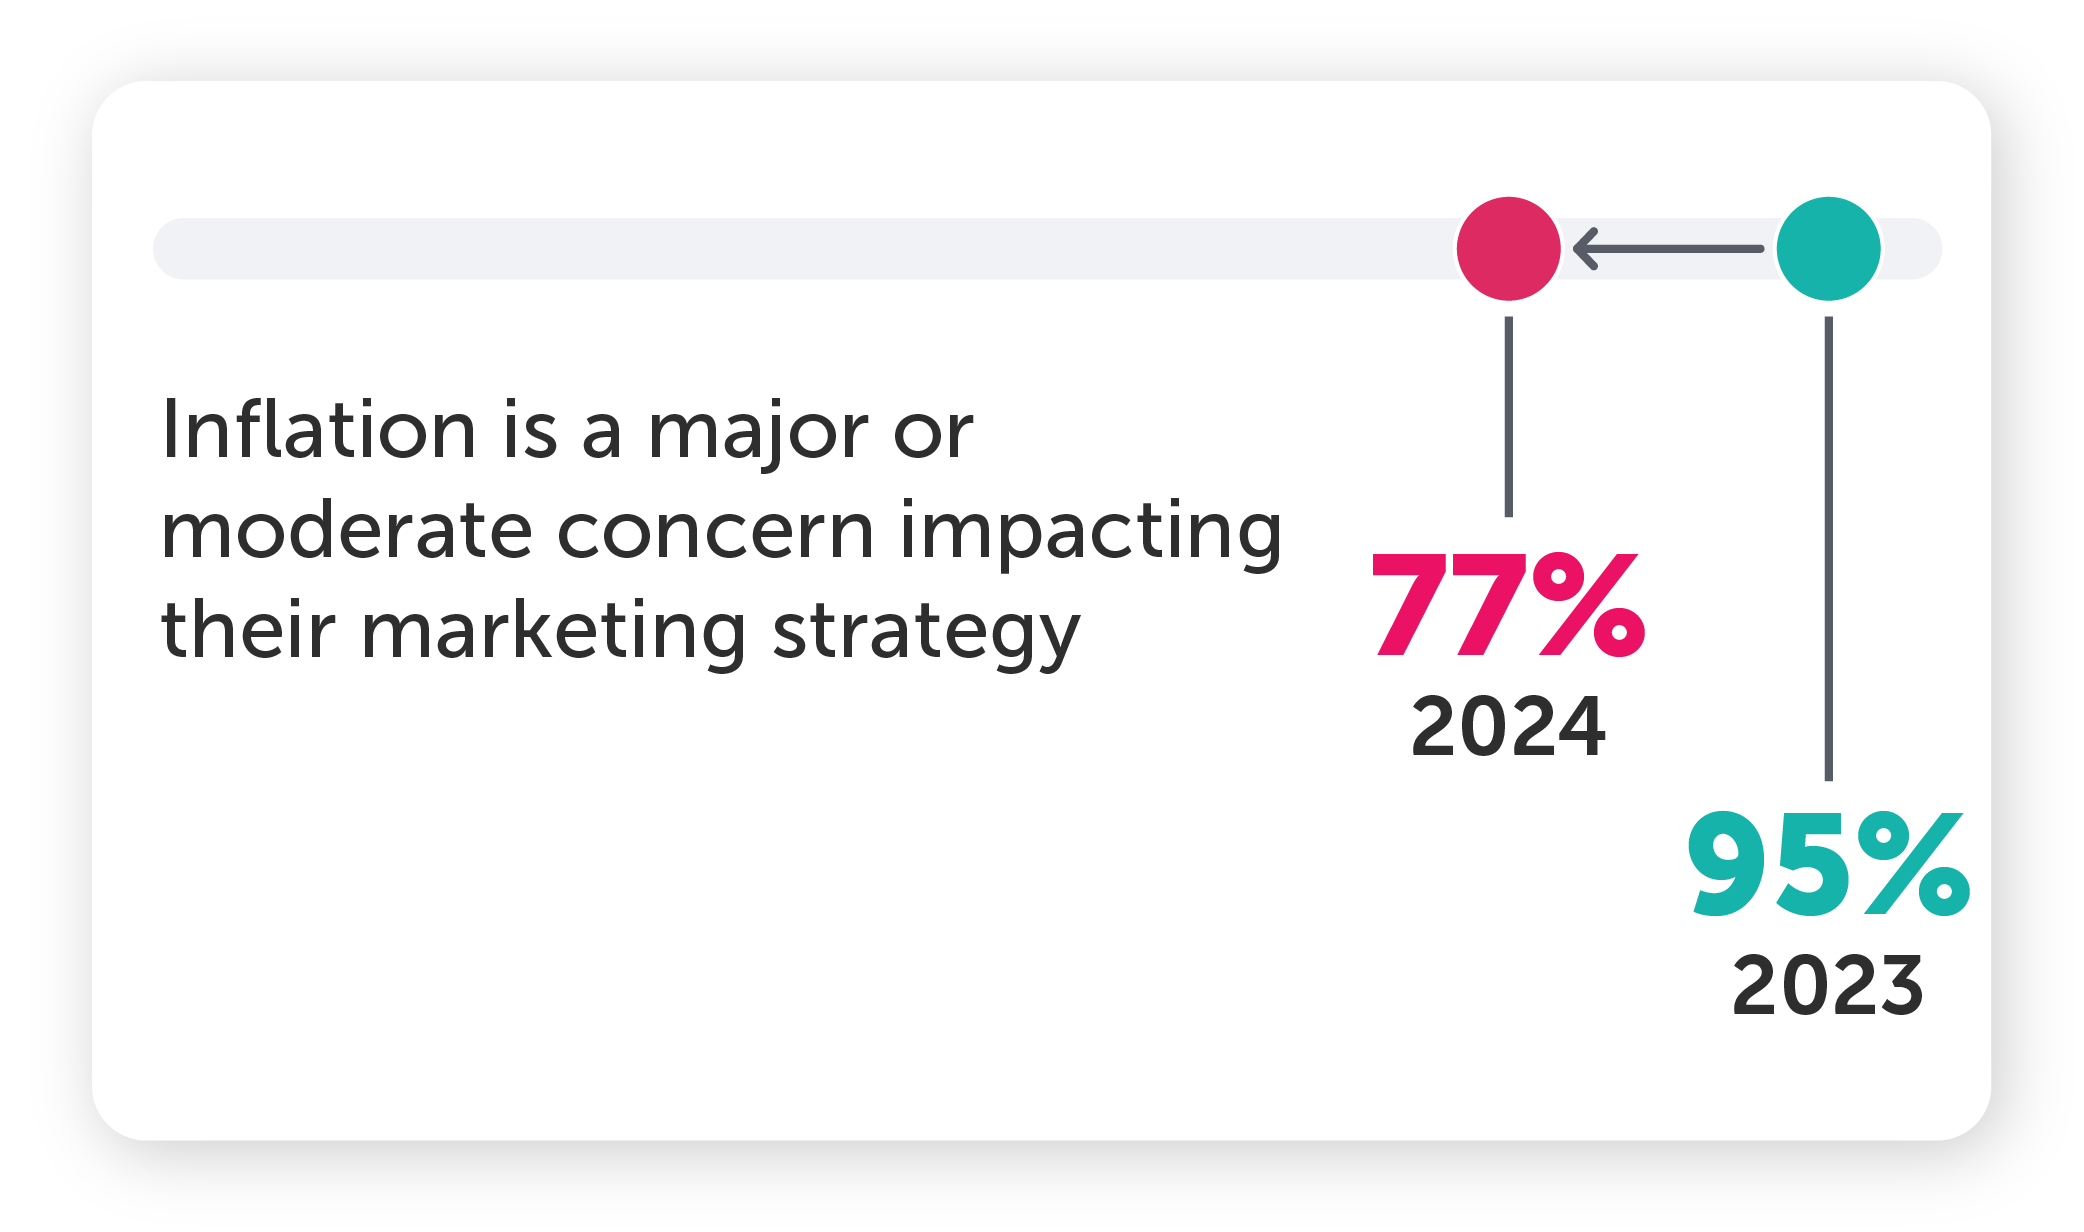
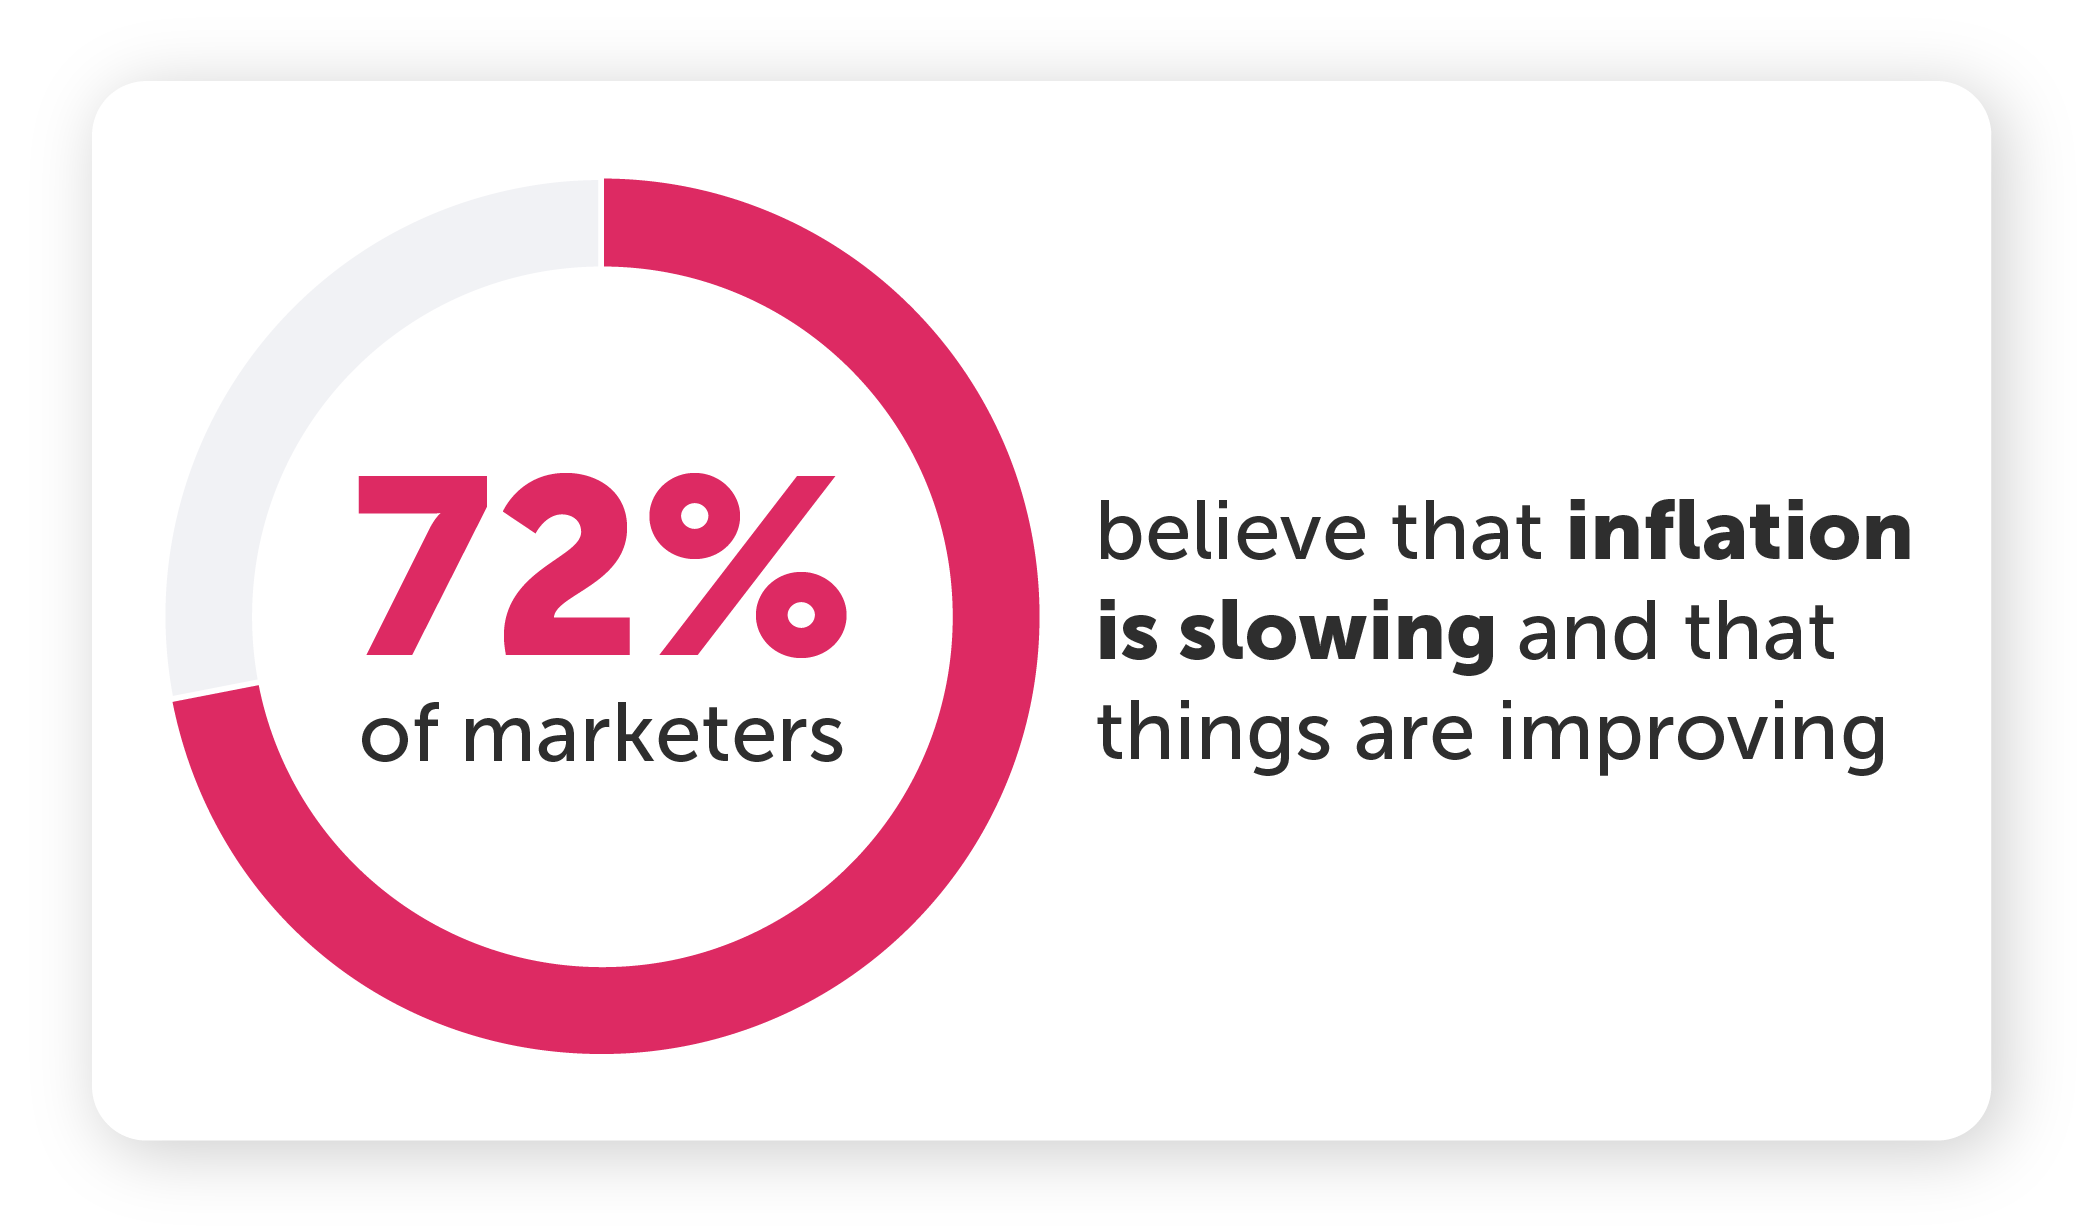
But despite 54% of marketers having negative views of the economy in 2024, there is significantly less concern about inflation’s impact on their marketing strategies. The majority also say they believe that things are improving. This could provide some much-needed relief for marketing budgets, which have shrunk in recent years.
However, it’s worth noting that a significant gap exists between marketers' and consumers' perceptions of current economic conditions and inflation's trajectory. For marketers, failing to recognize this disconnect poses a risk of alienating consumers and sacrificing market share. And at a time when private labels are expanding their presence in an effort to fulfill consumers’ demands for lower-priced alternatives, it’s more critical than ever for marketers to meet consumers where they are.
The economy’s impact on grocery spend & shopping habits
Despite improvements from 2023, the majority of consumers and marketers hold negative views of the current economy. These perceptions continue to affect the state of spend in significant ways, particularly when it comes to what consumers are buying and how much they’re spending at the grocery store.
Even though overall spend is flat, consumers are feeling the compounding effects of inflation’s impact on grocery prices. Sixty percent of consumers believe they’re spending more this year than they were last year, and it’s having a direct impact on their grocery spending habits.
As a result of this impact, saving money on groceries remains a top priority for consumers, despite a small decrease in importance from 2023. And while shoppers’ motivations for saving money varied — from feeling more financially secure to needing the extra money to get by — offsetting price increases was the primary motivator for consumers.
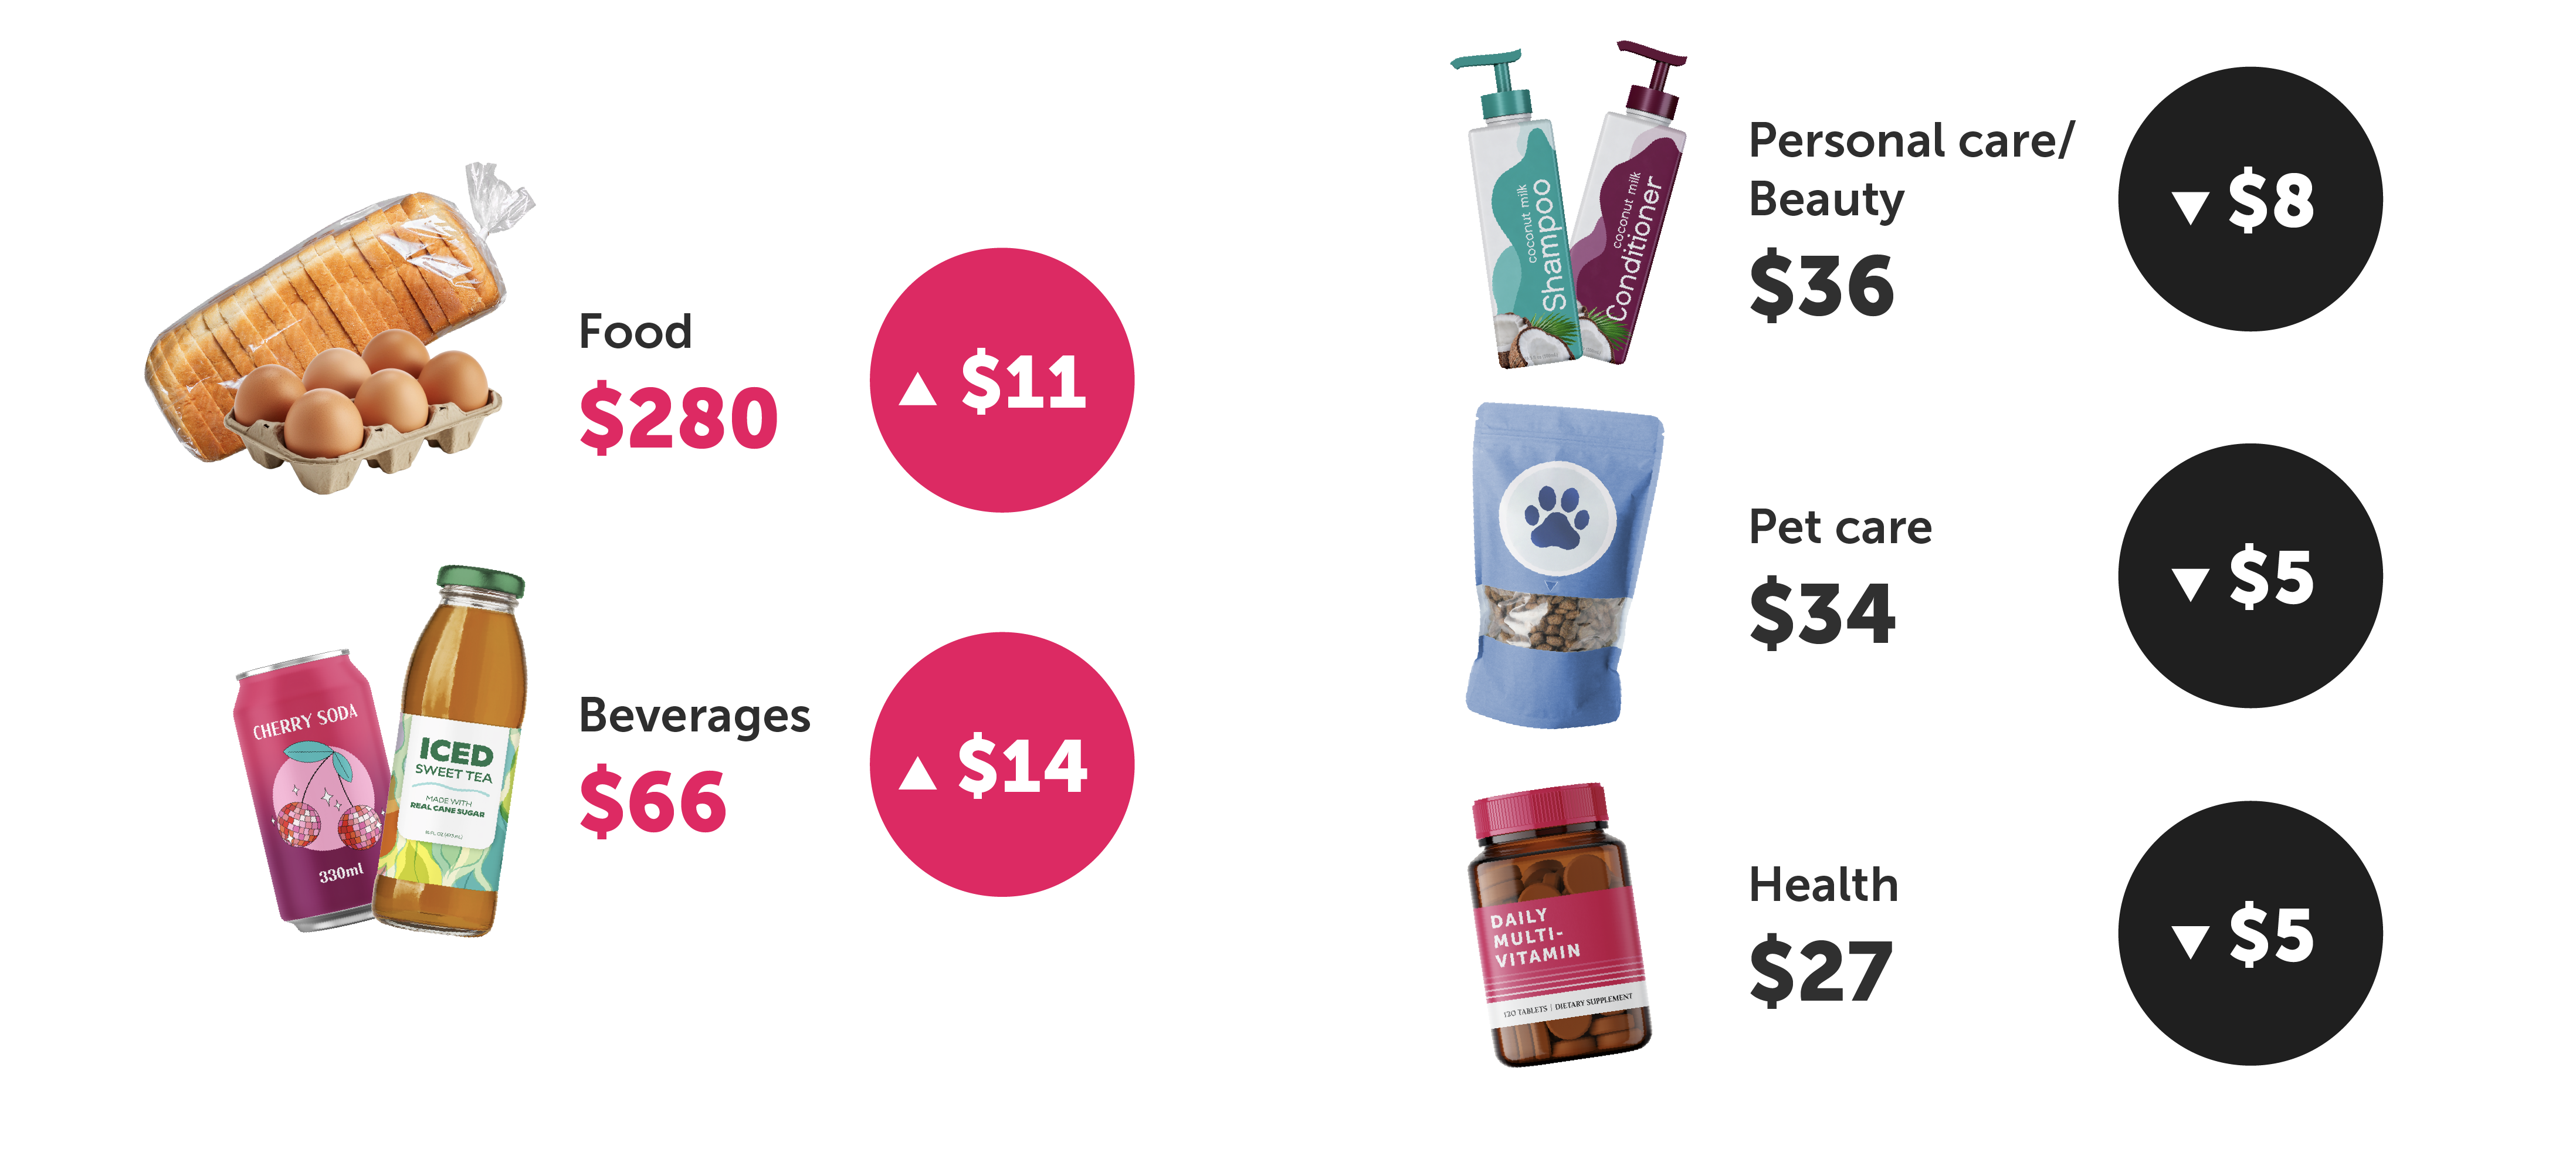
In an effort to offset rising grocery costs, many consumers are cutting back on discretionary purchases and focusing on essential items like food and beverages. On average, consumers reported spending $25 more per month on food and beverages — an increase of $302 per year — and 70% of those who are spending more attribute it directly to price increases.
On the other hand, spend and purchase incidence across more discretionary categories has decreased, with the personal care, pet care, and health categories taking the biggest hits. Of the consumers who reported spending less, 46% attribute it to cutting back and 21% attribute it to switching to less expensive alternatives.
Regardless of product necessity, shoppers demonstrate a strong propensity for switching to lower-priced alternatives when faced with rising costs. To combat higher prices on essentials, 53% of consumers say they buy products at a lower price. However, discretionary items face a much higher risk of losing the sale altogether. When faced with rising costs on non-essentials, 19% of consumers say they simply opt out of a purchase.
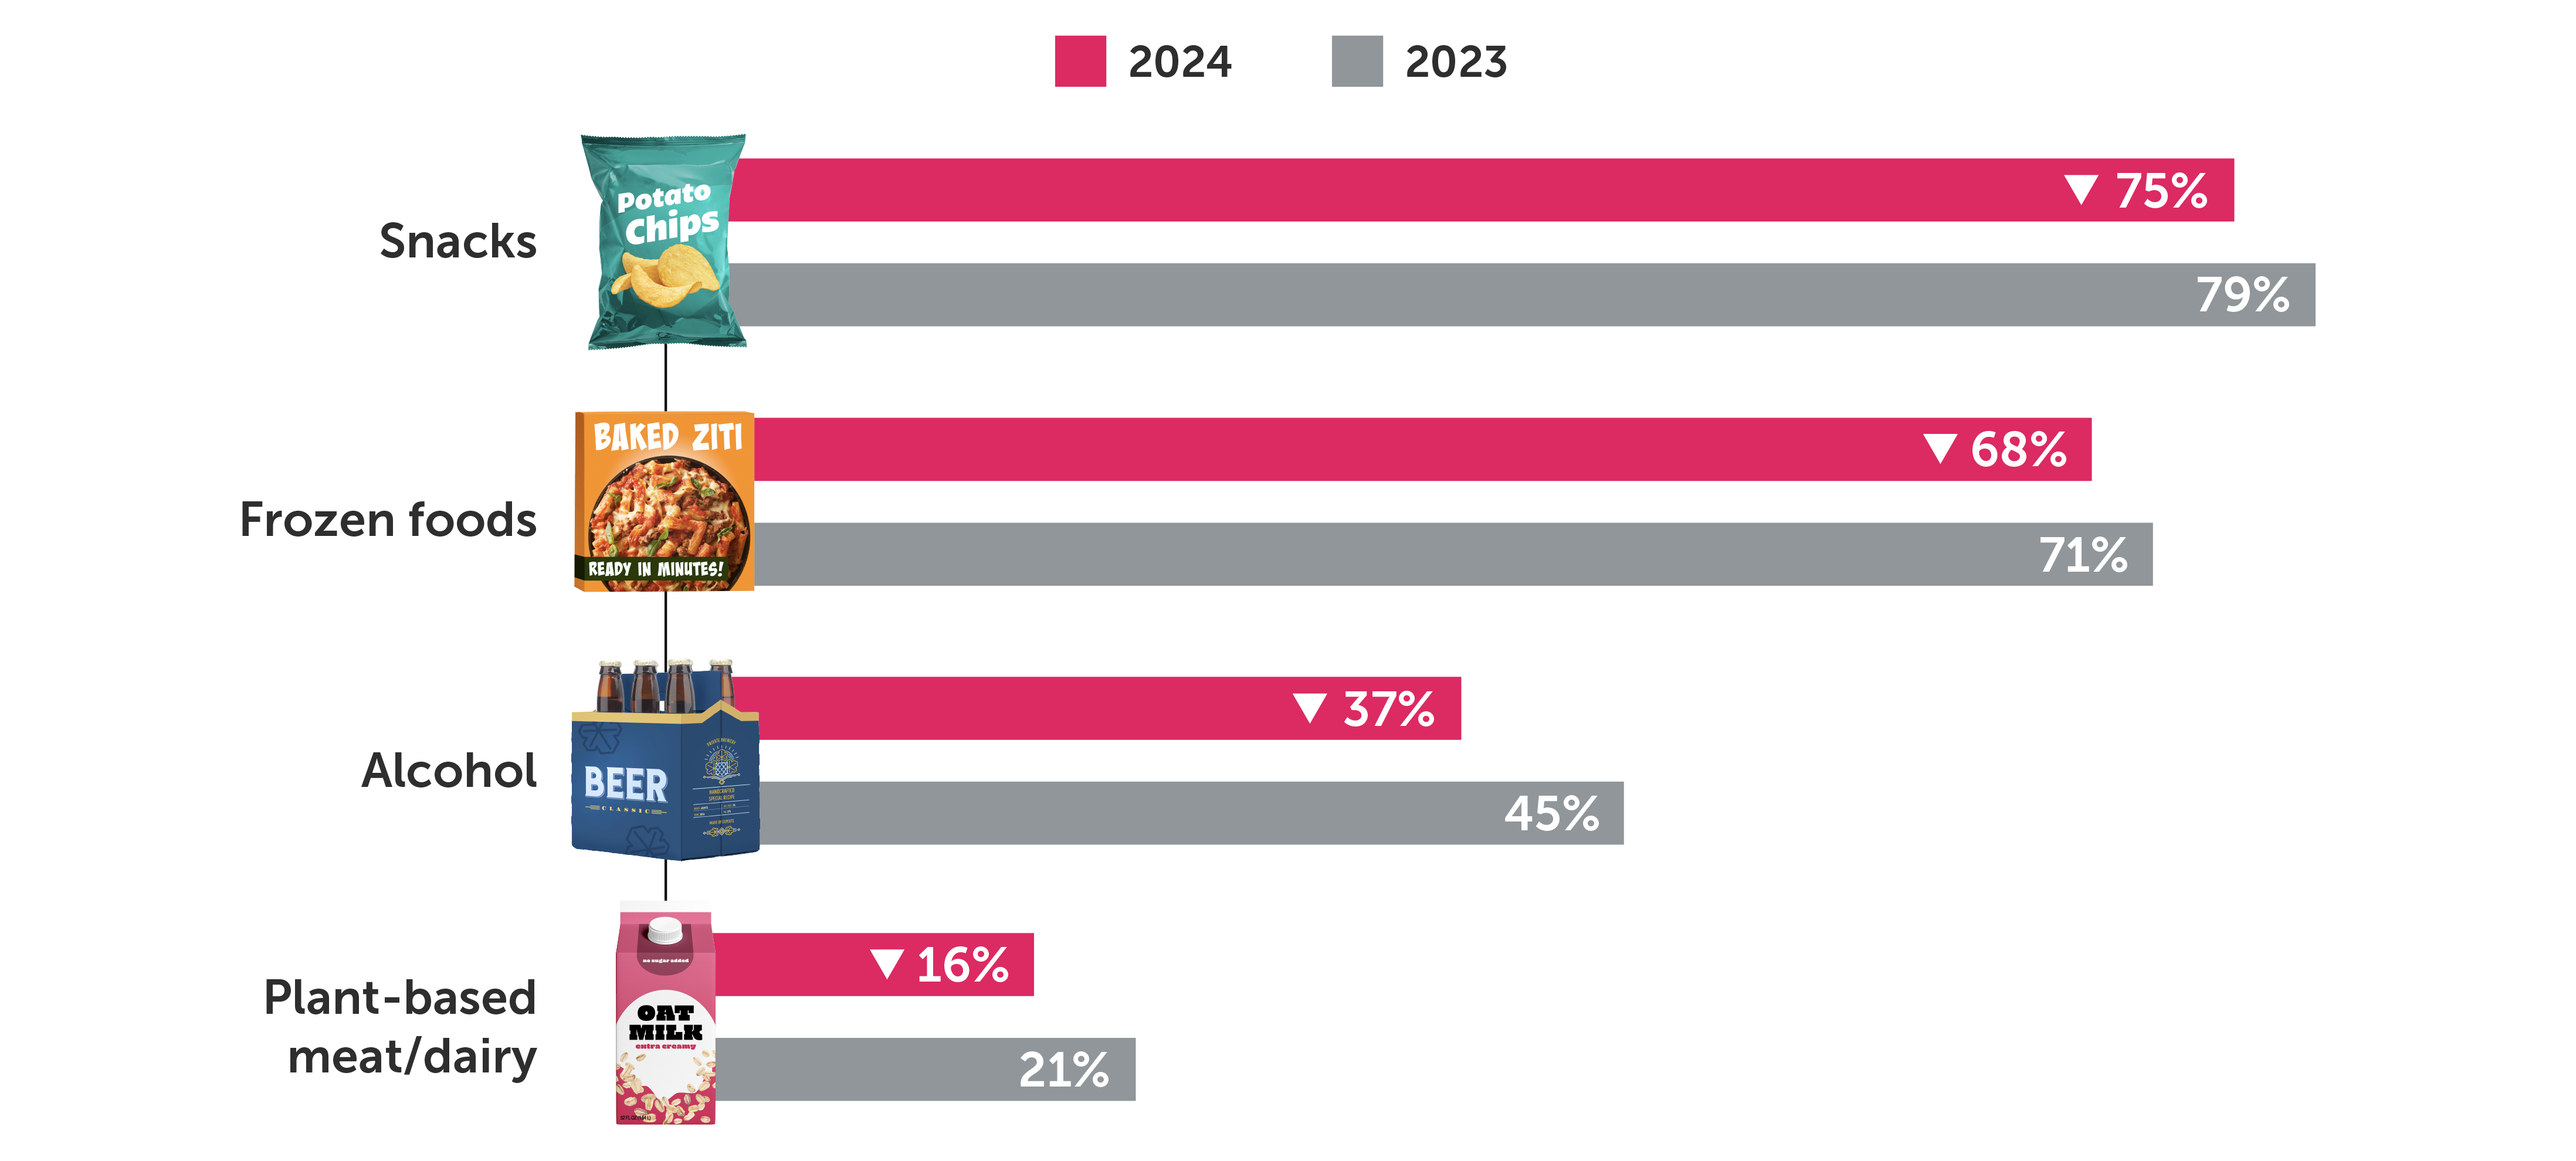
Not all food and beverage categories are viewed as essential though, and with more consumers looking to cut back, sales across some of these categories have declined. Snacks, frozen foods, alcohol, and plant-based meat and dairy saw significant decreases in purchases year over year as consumers have tightened their wallets.
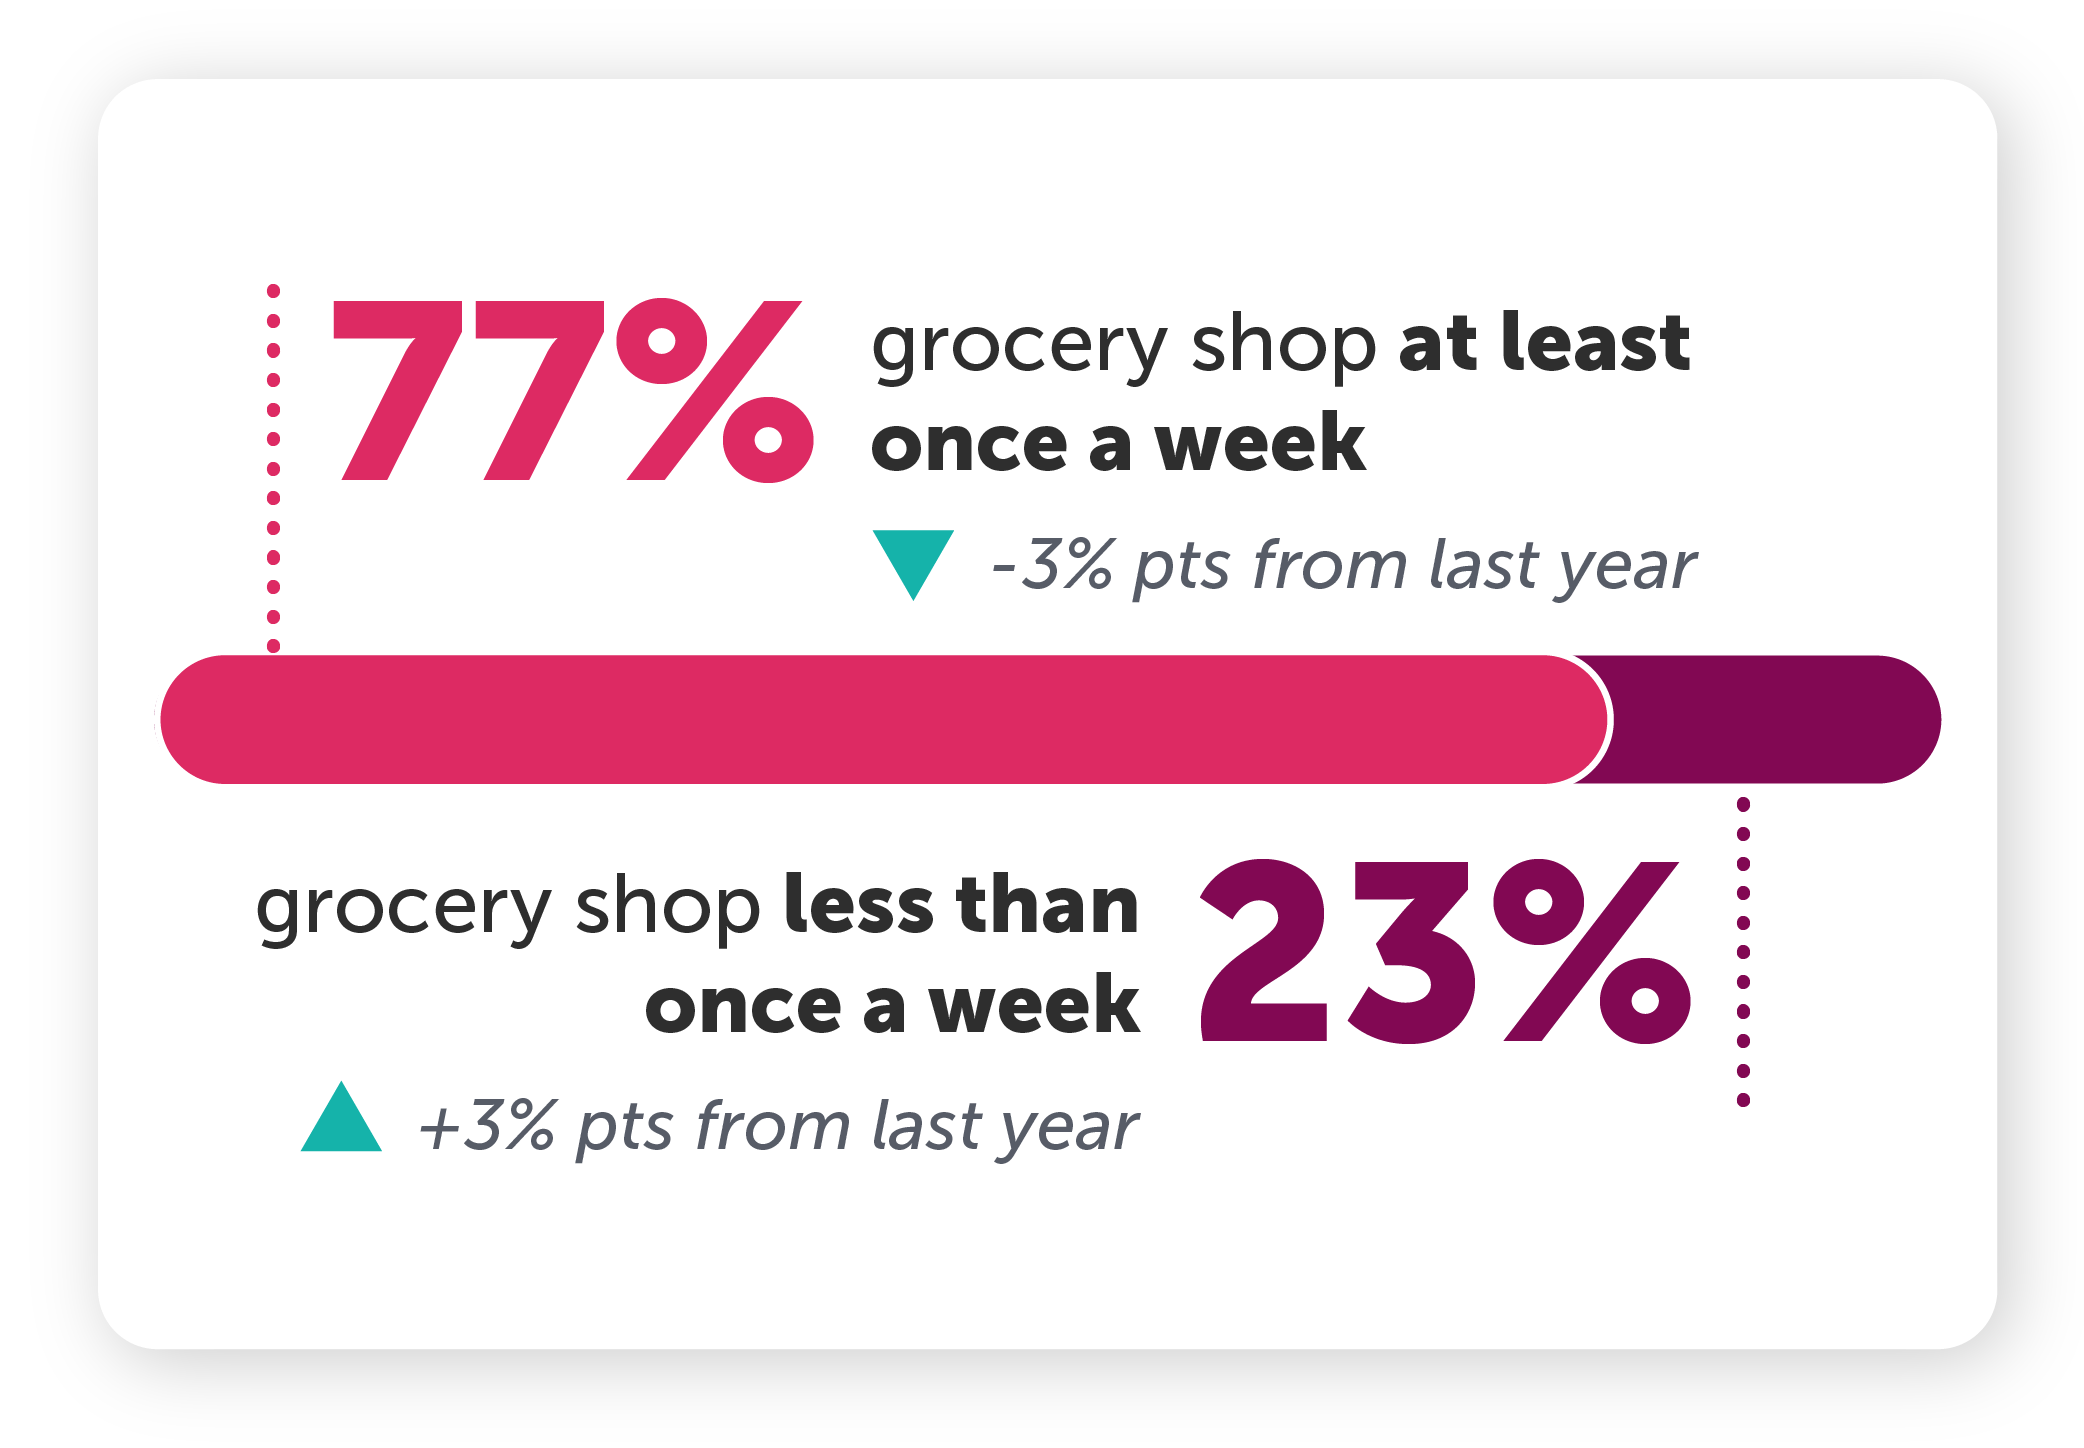
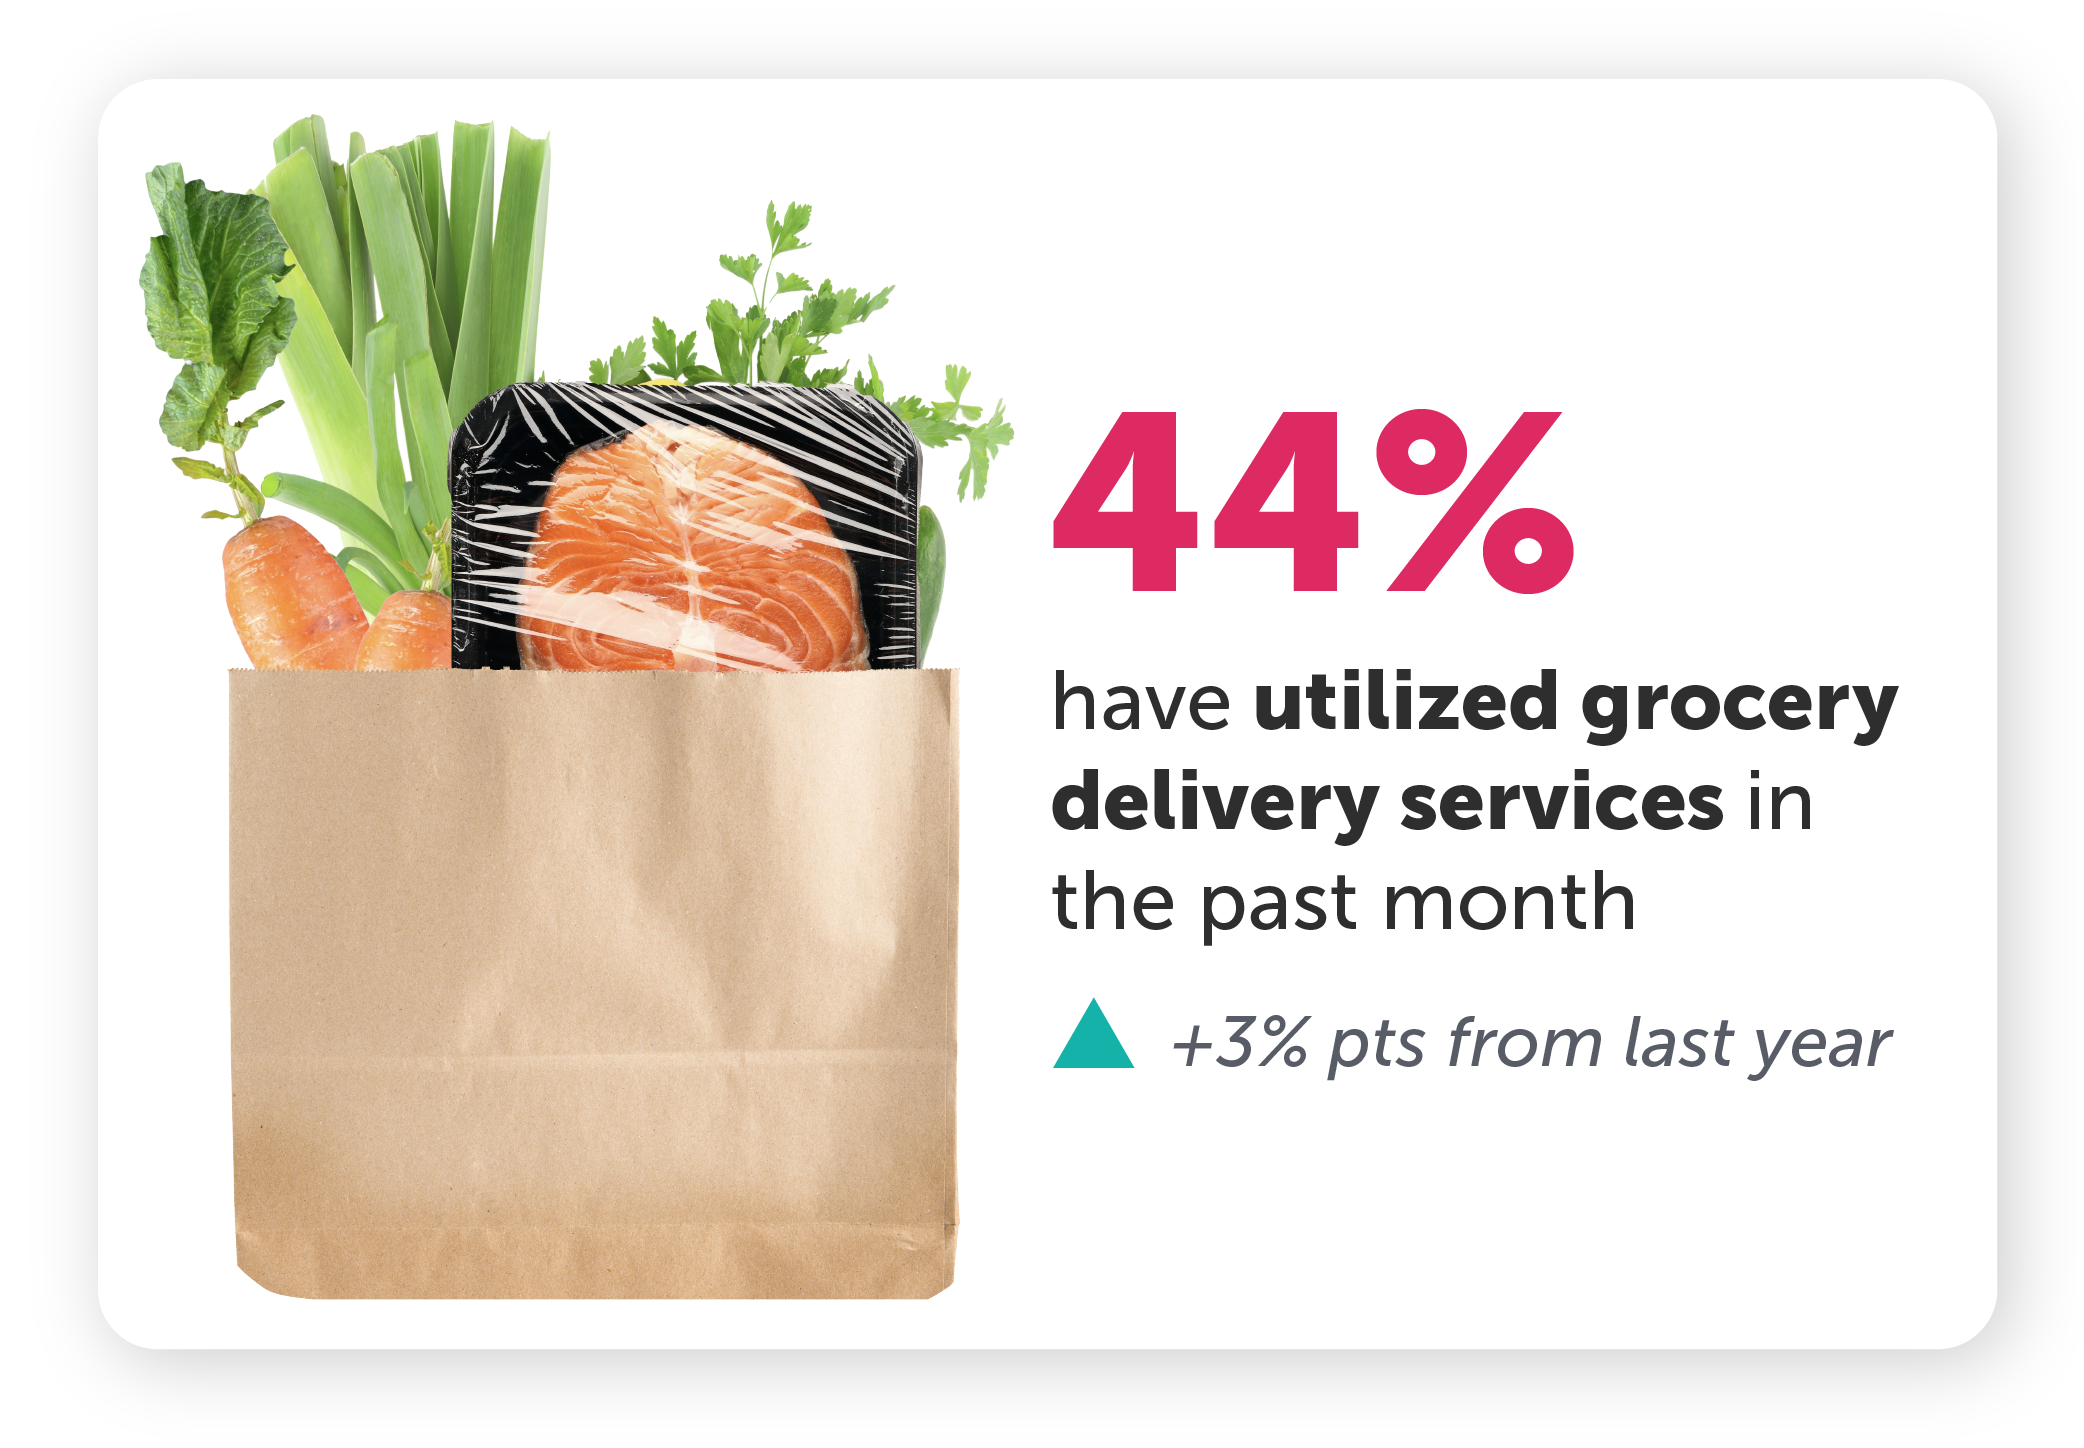
As they say, time is money, and as shoppers look to better manage their budgets, they’re also adapting their grocery shopping habits to better manage their time. This year, consumers are shopping less often and more likely to use grocery delivery services. This tracks with the continued decline in the number of monthly store trips we’ve seen in consumer purchase data across a number of categories.
What’s influencing consumer purchasing decisions?
Of the consumers we surveyed, 85% say it’s important to save money on groceries right now. Consumers are more price sensitive than ever, but they’re also creatures of habit. These are perhaps the two biggest challenges that brands need to overcome. To get shoppers’ attention and encourage them to give their products a try, brands need to consider a range of tactics and leverage them strategically in their promotional plans.
According to consumers, decision-making at the grocery store is most influenced by price, quality, store sales, and familiarity — in that order. However, it’s often a combination of these factors that ultimately drive a shopper to make a purchase. For brands looking to attract new customers and retain existing ones, it’s important to consider all of these factors when developing marketing strategies.
On the flip side, social media influencers as well as ads on social media, TV, and online all ranked as the least impactful methods for driving their decisions. Though ads can certainly play their part in a well-rounded marketing plan — and help increase consumers’ familiarity with a brand — they don’t seem to have the same immediate impact on grocery purchasing decisions.
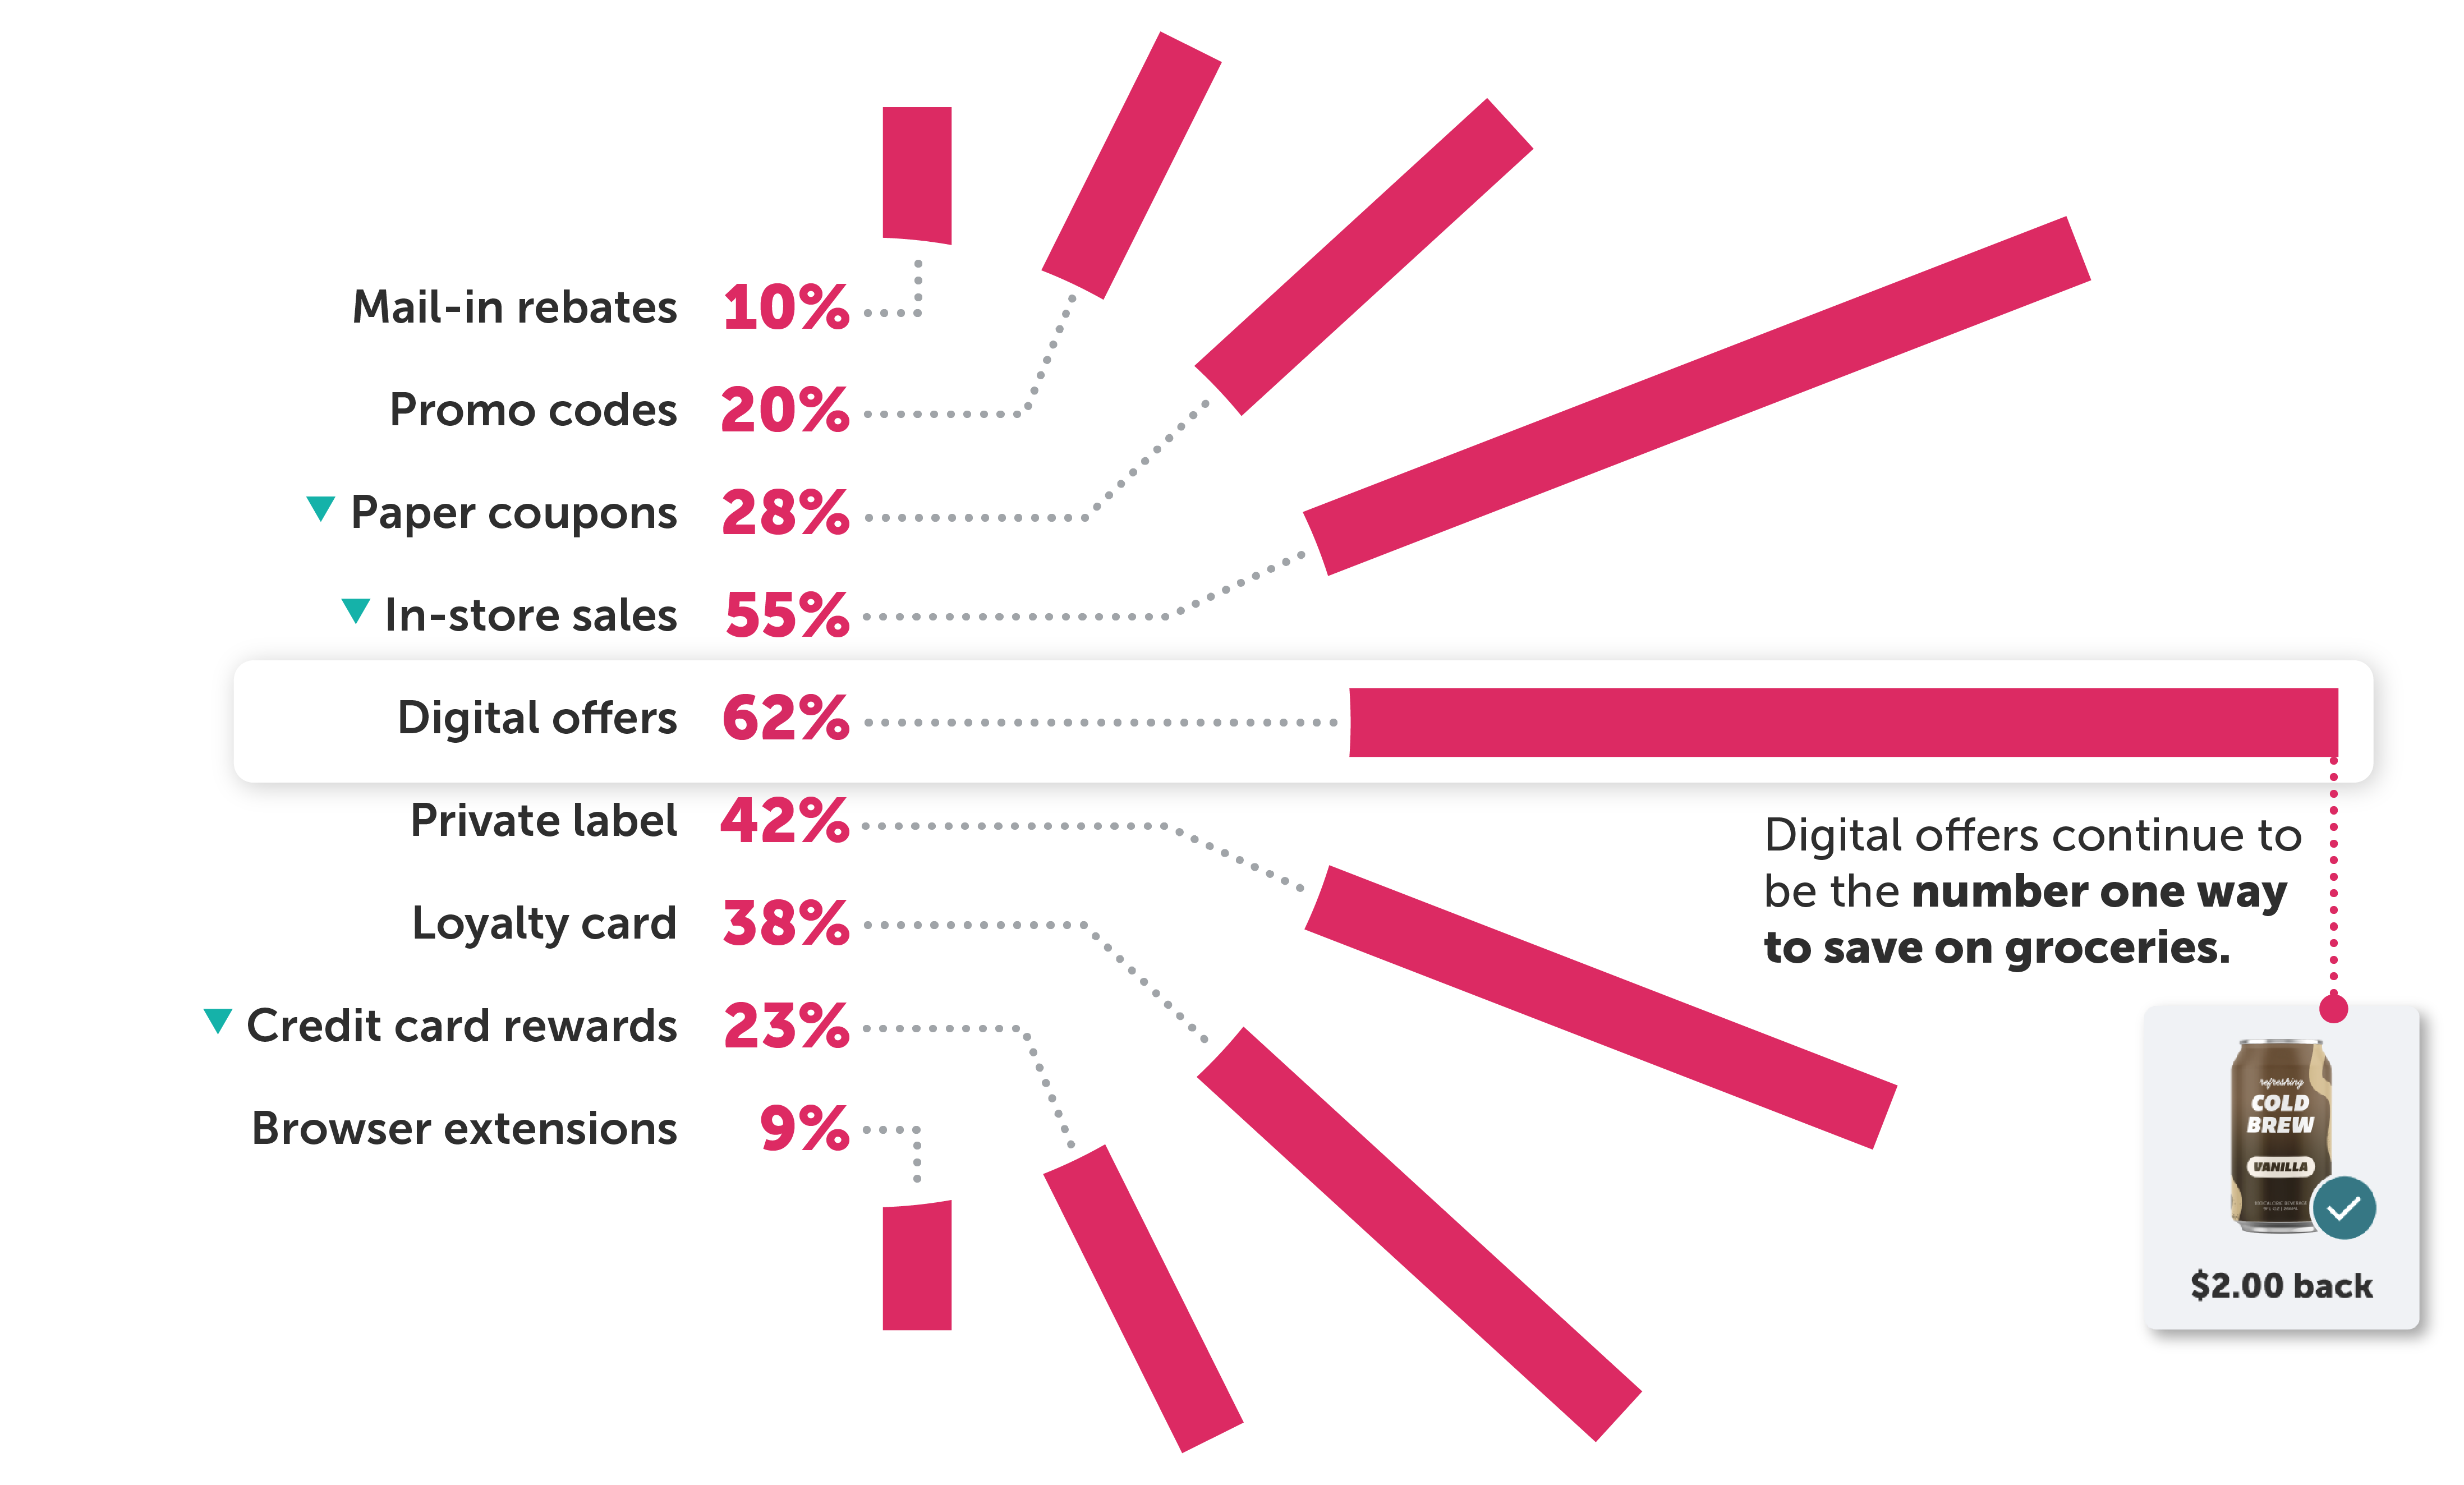
There are a number of factors that influence consumers’ purchasing decisions, but price is undeniably the most important. And it isn’t just the price consumers see on the shelf of their local grocery store that matters. Those savings come in many forms, from digital rewards and loyalty cards to promo codes and rebates. For today’s shoppers, digital offers continue to be the No. 1 way to save on groceries, even increasing 1% from 2023. Traditional saving methods — like in-store sales, paper coupons, and credit card rewards — though still valuable to consumers, saw a decline this year. This proves the importance of digital channels in the grocery shopping experience — evidence that’s further supported by other data from our research.
How open are consumers to trying new products?
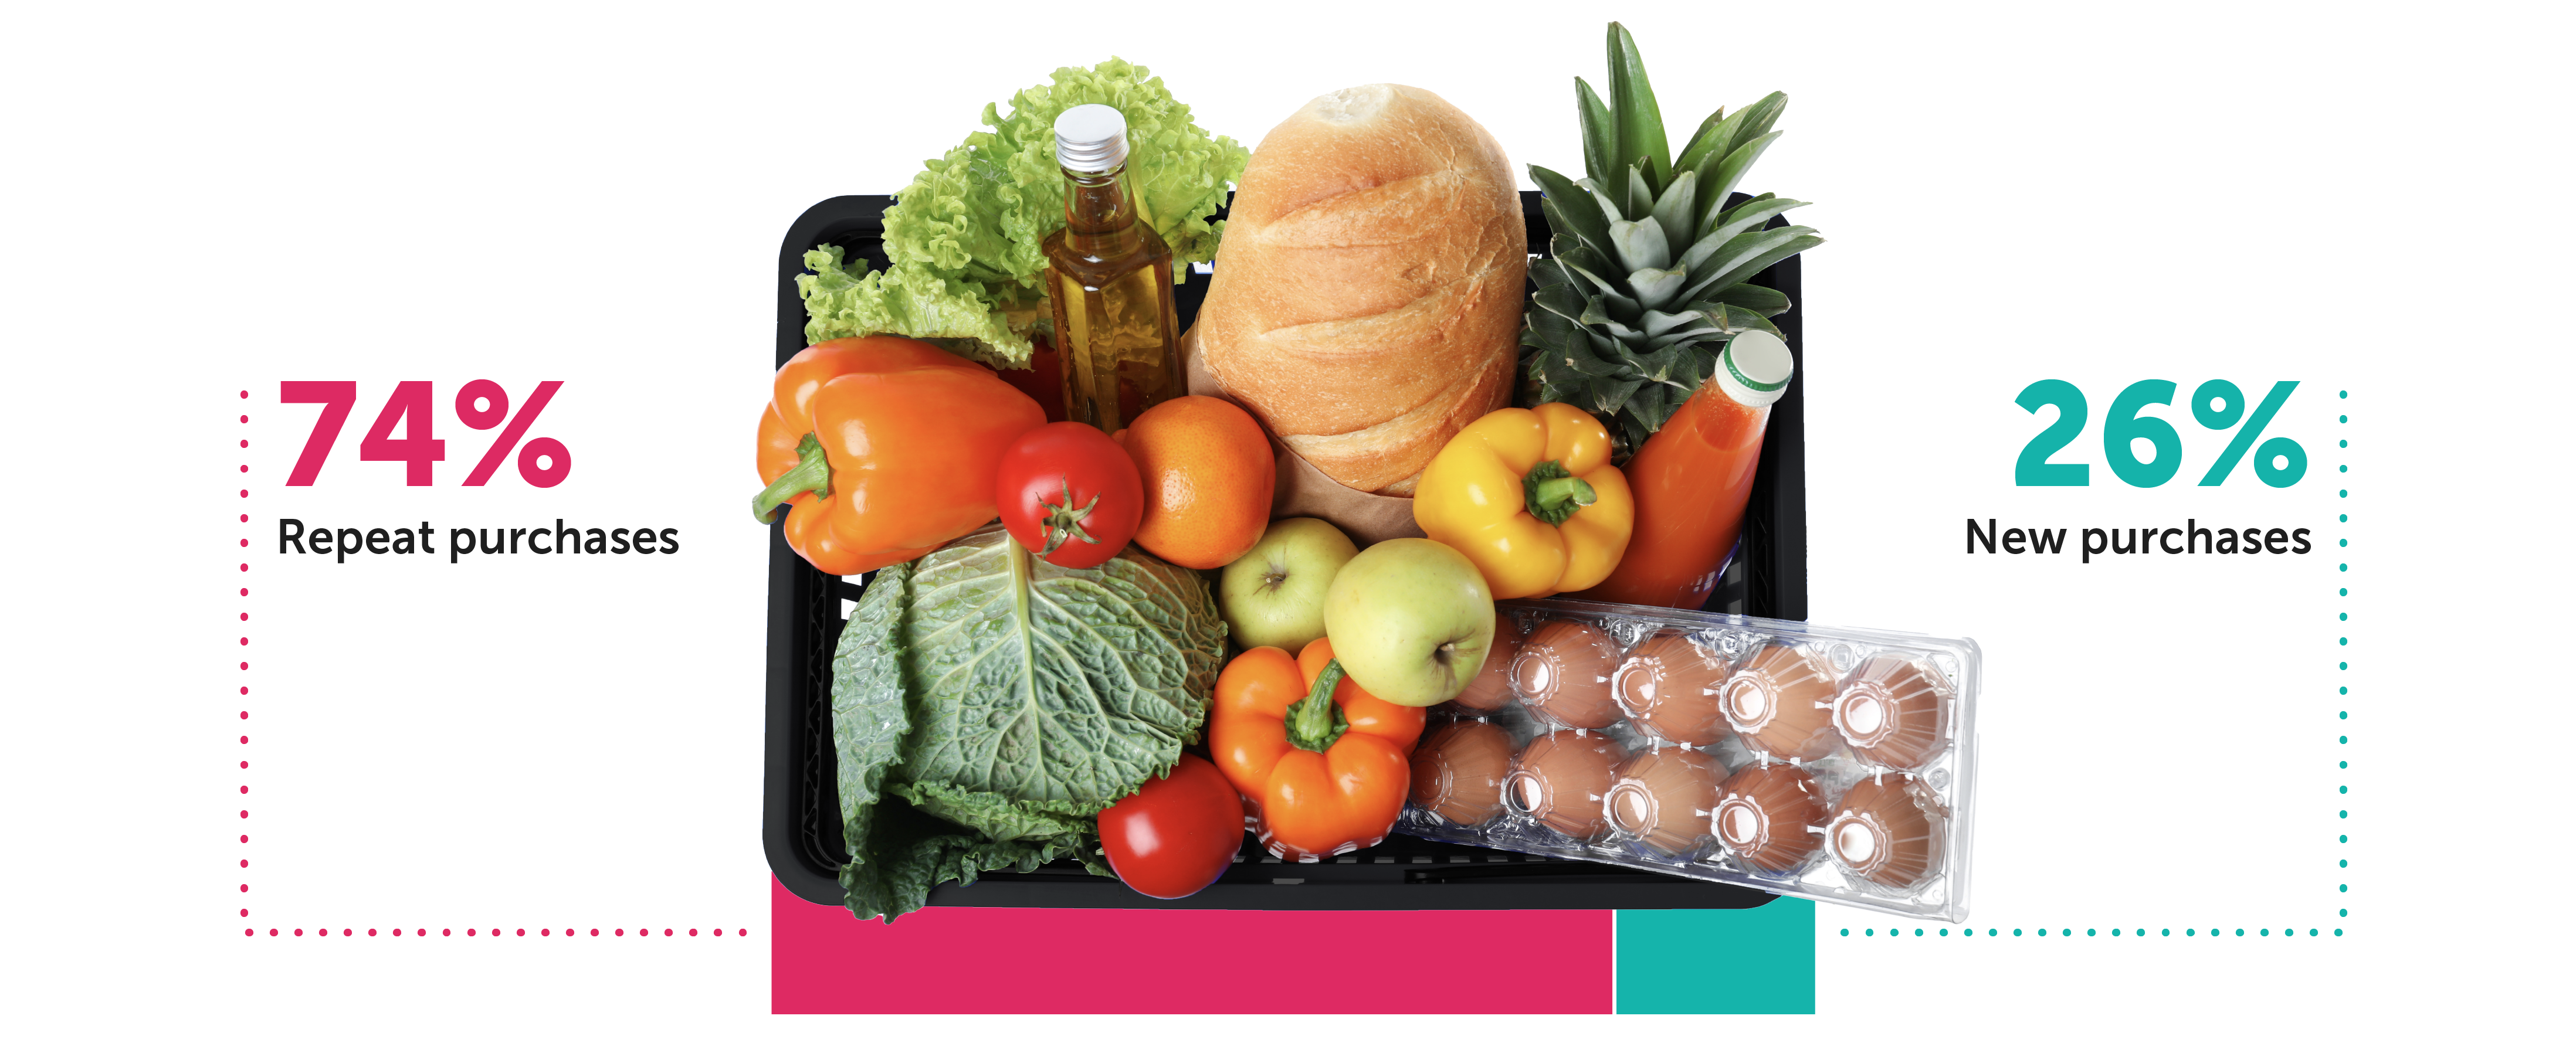
Shoppers stick with the items they’re familiar with — the products they and their families know and love. In fact, consumers say that 74% of their grocery carts are made up of products they’ve previously purchased. This can make it harder for brands to get in the door with new consumers and drive much-needed brand trial.
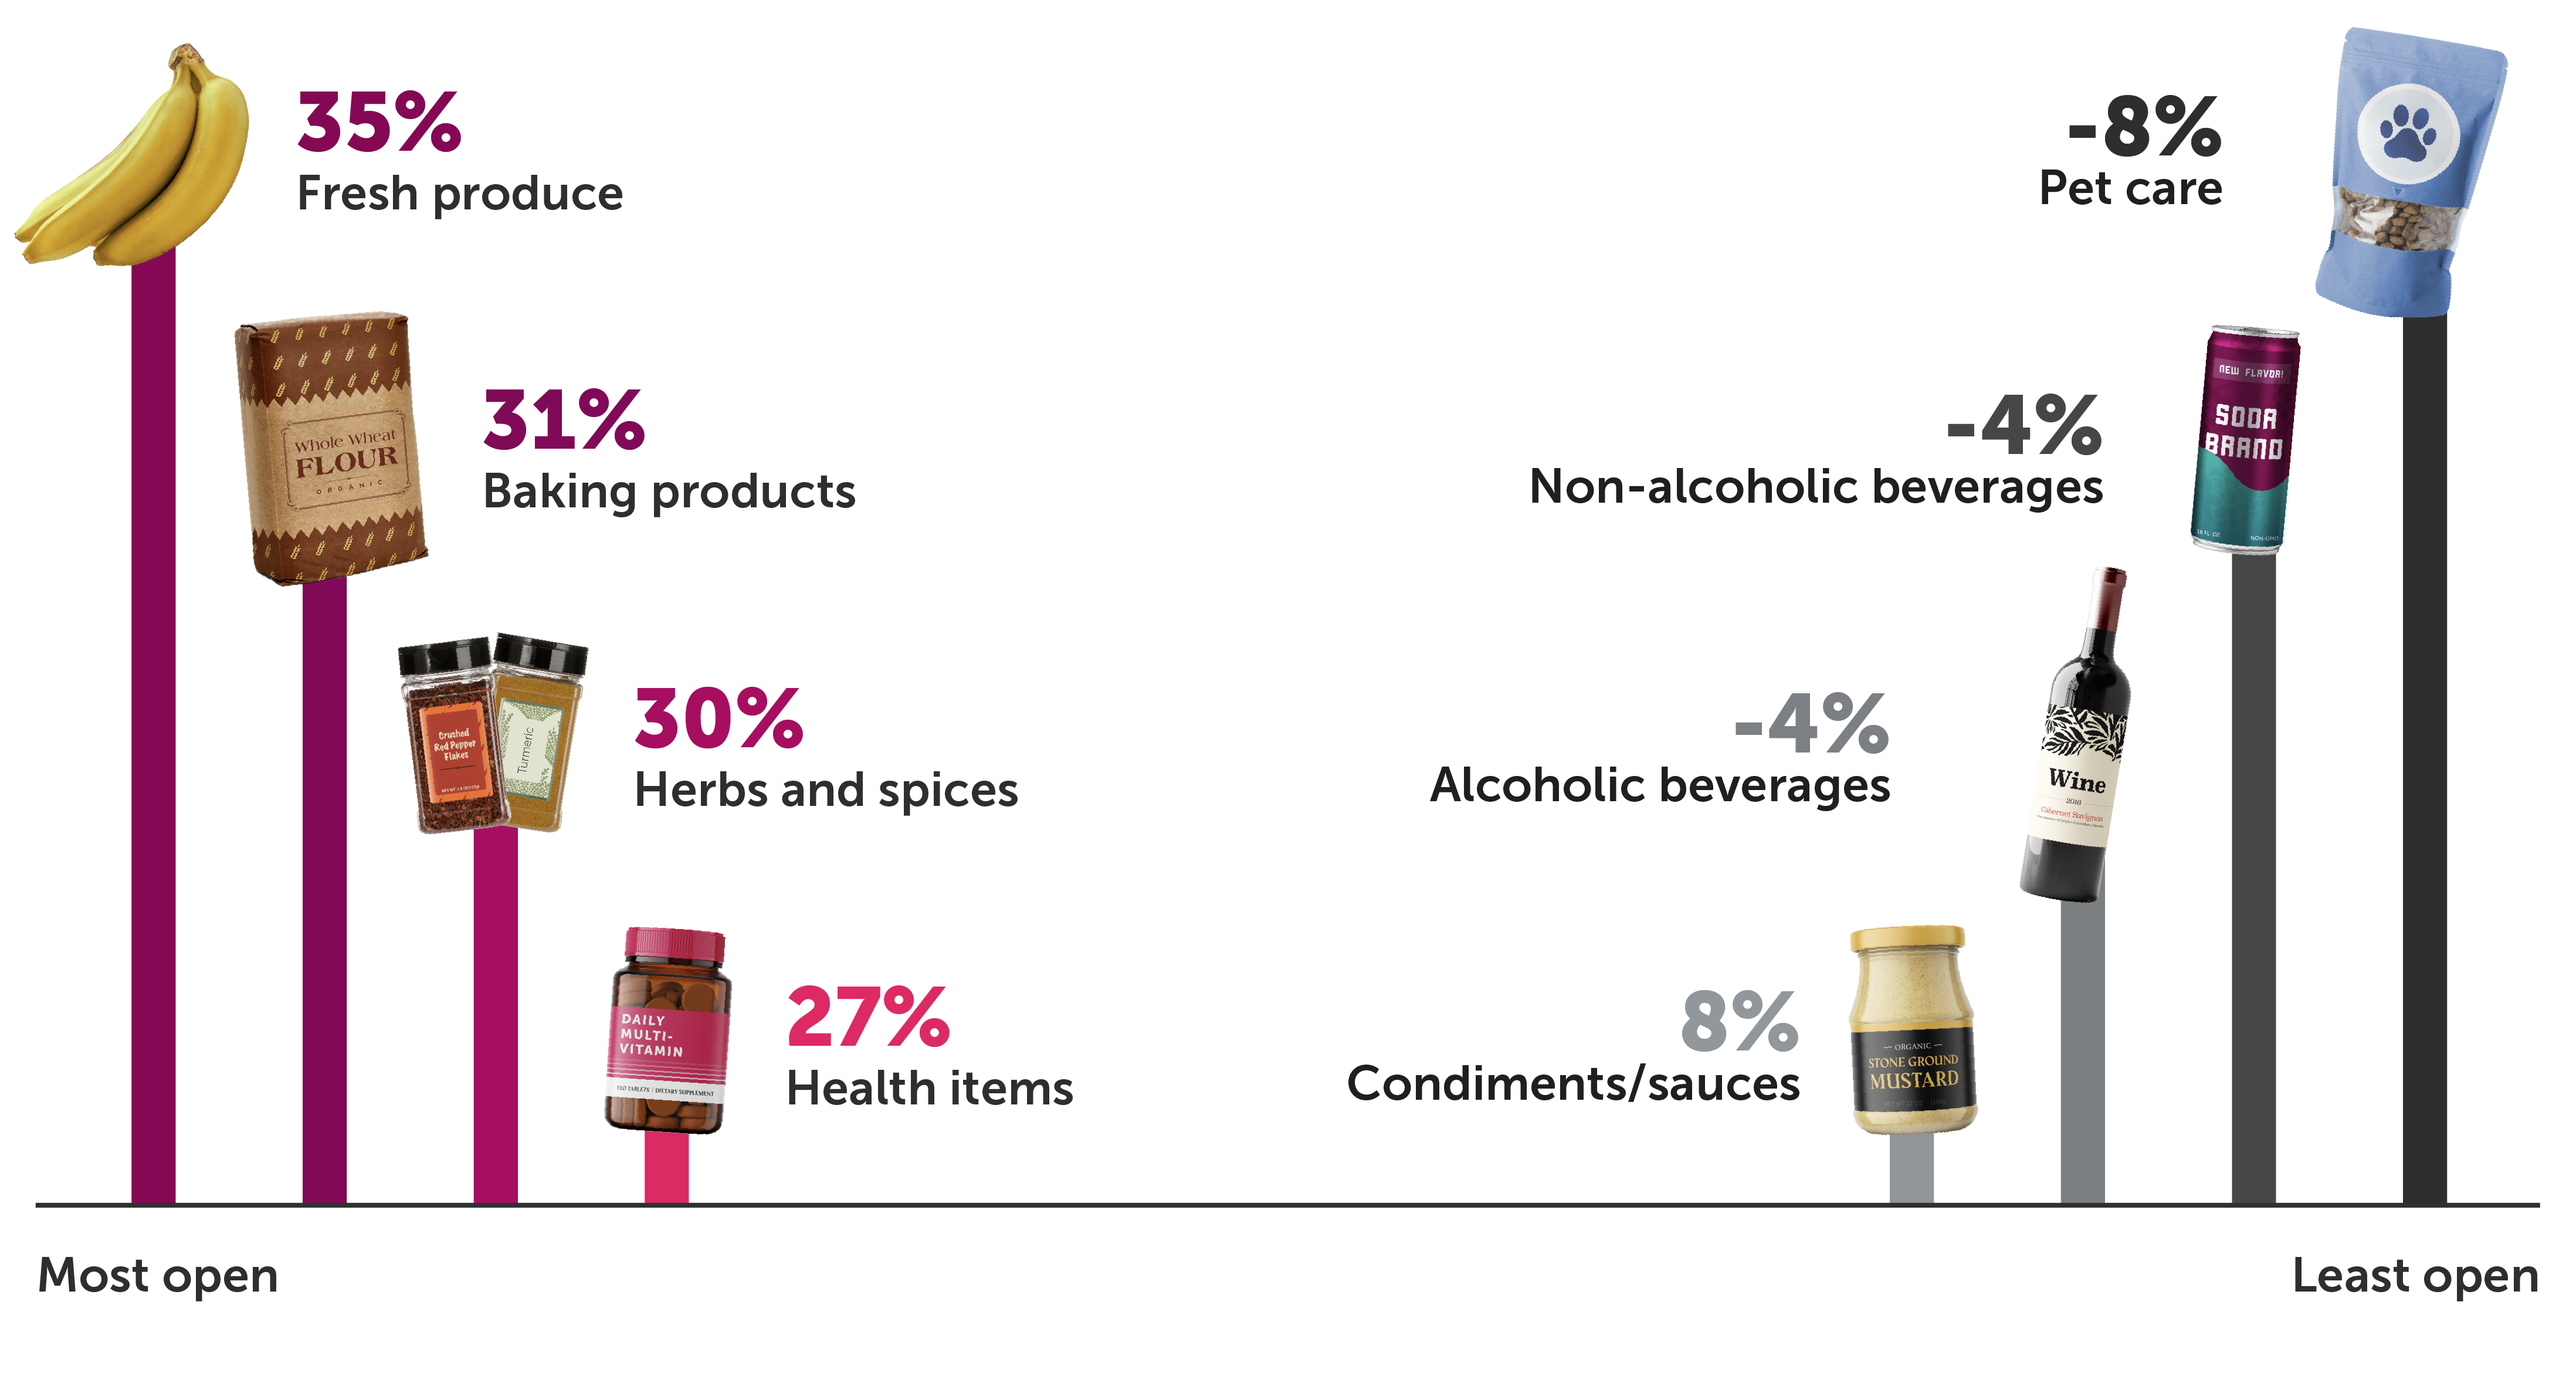
When it comes to branching out, consumers have varied levels of loyalty depending on the product category. On average, 32% of shoppers are open to any brand, while only about 15% consider themselves completely brand loyal. The rest fall somewhere in between, leaving a net openness of 17%. This group represents the consumers who are most likely to be swayed to try a new product.
However, these numbers begin to shift pretty drastically when we zoom in at the category level, indicating that consumer loyalty can vary depending on what they’re buying. Categories like fresh produce see the most brand openness at 35%, while pet care sees the lowest at -8%.
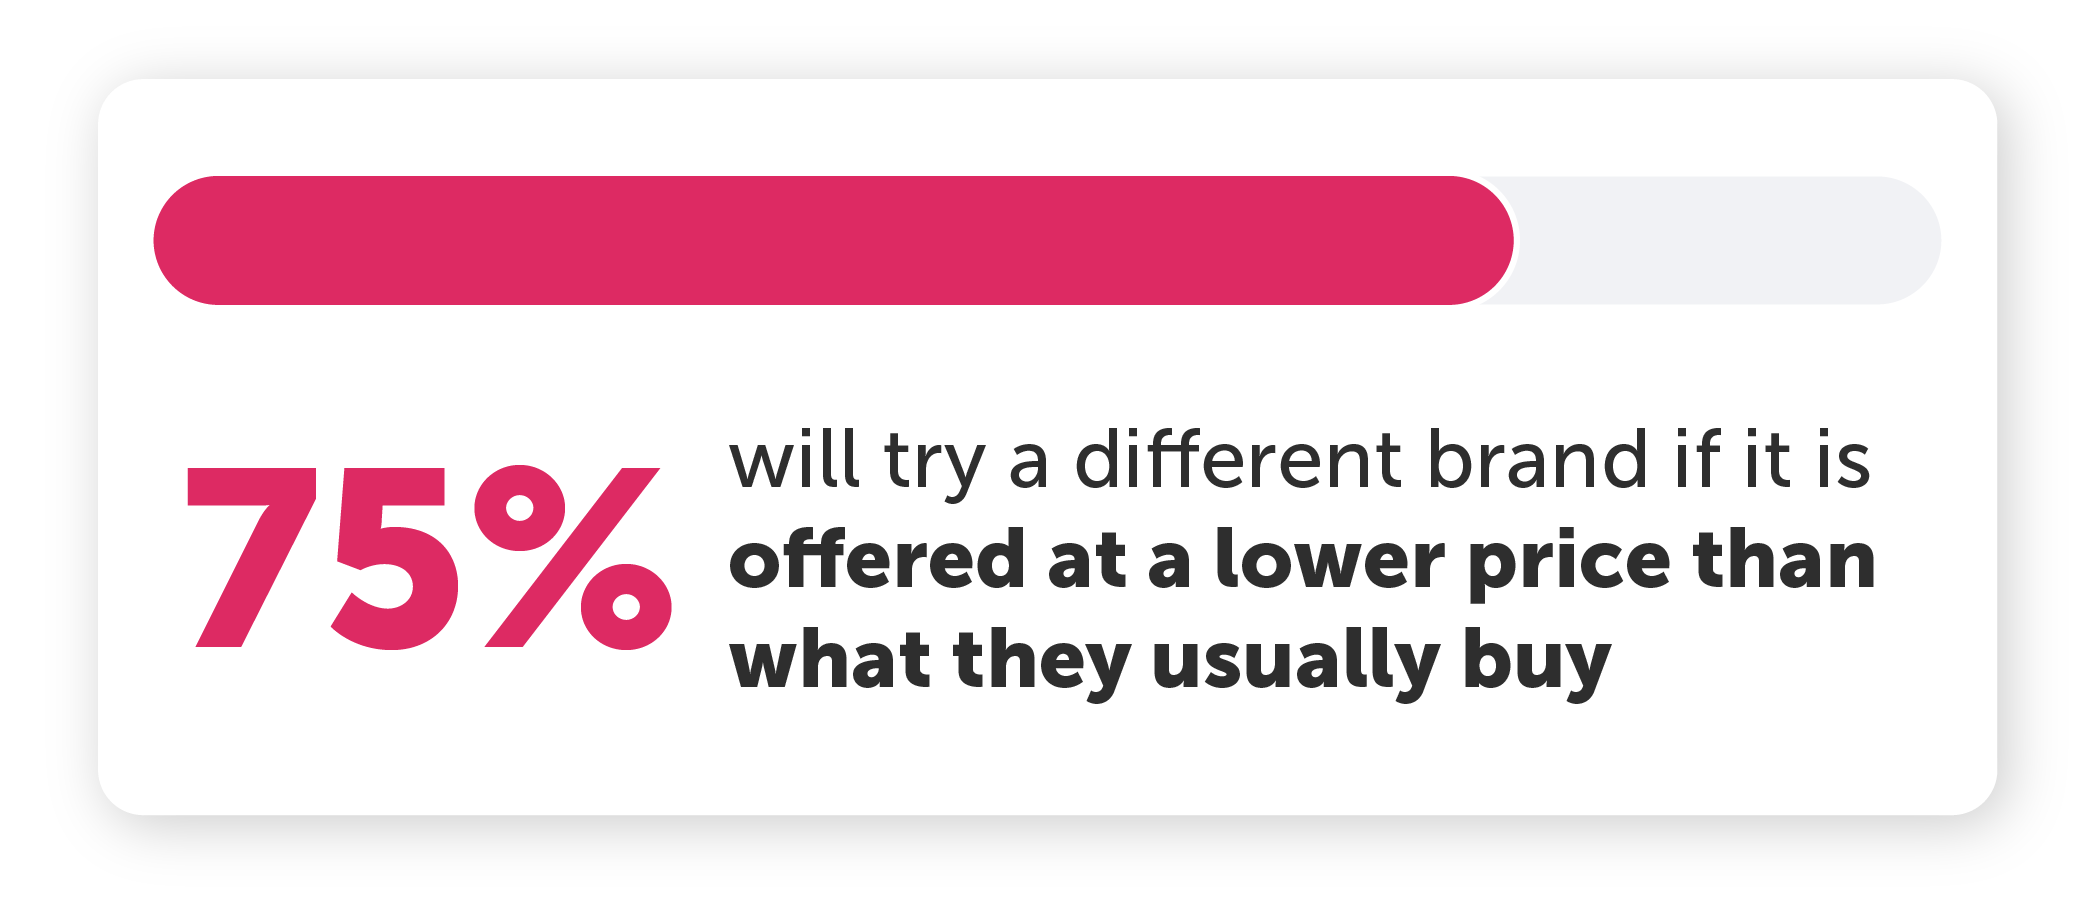
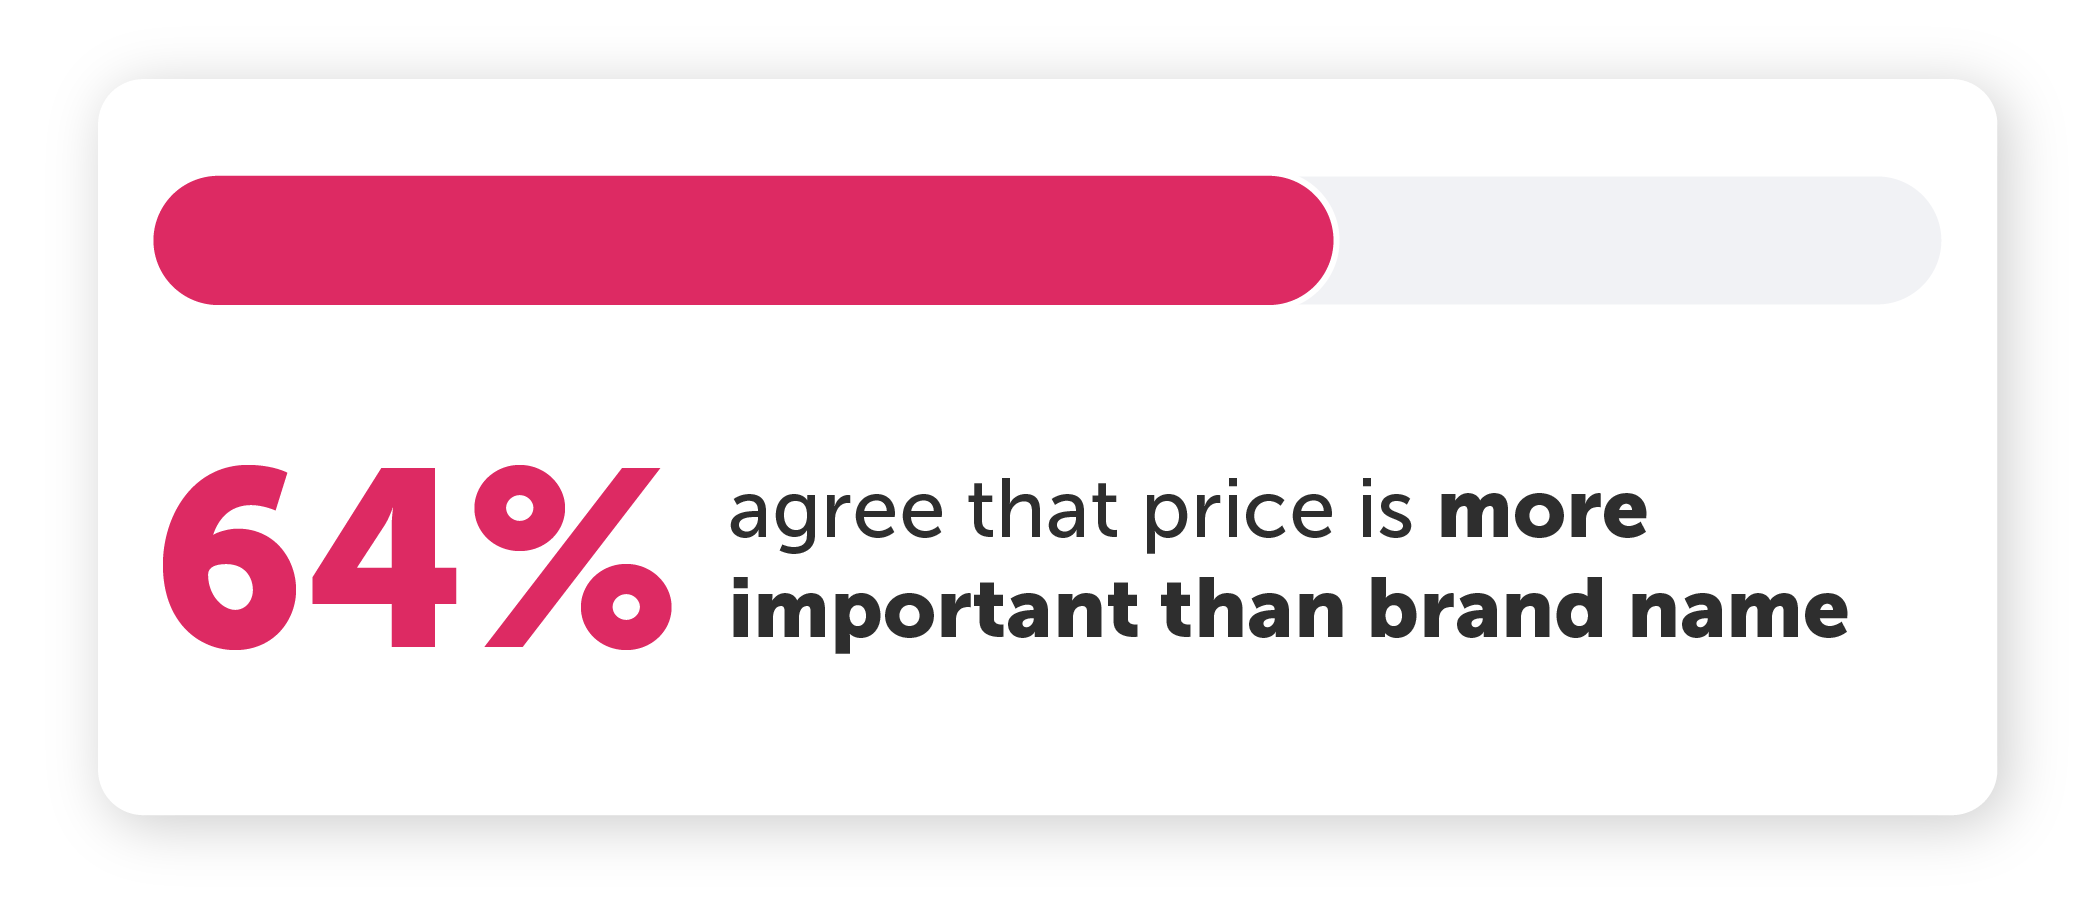
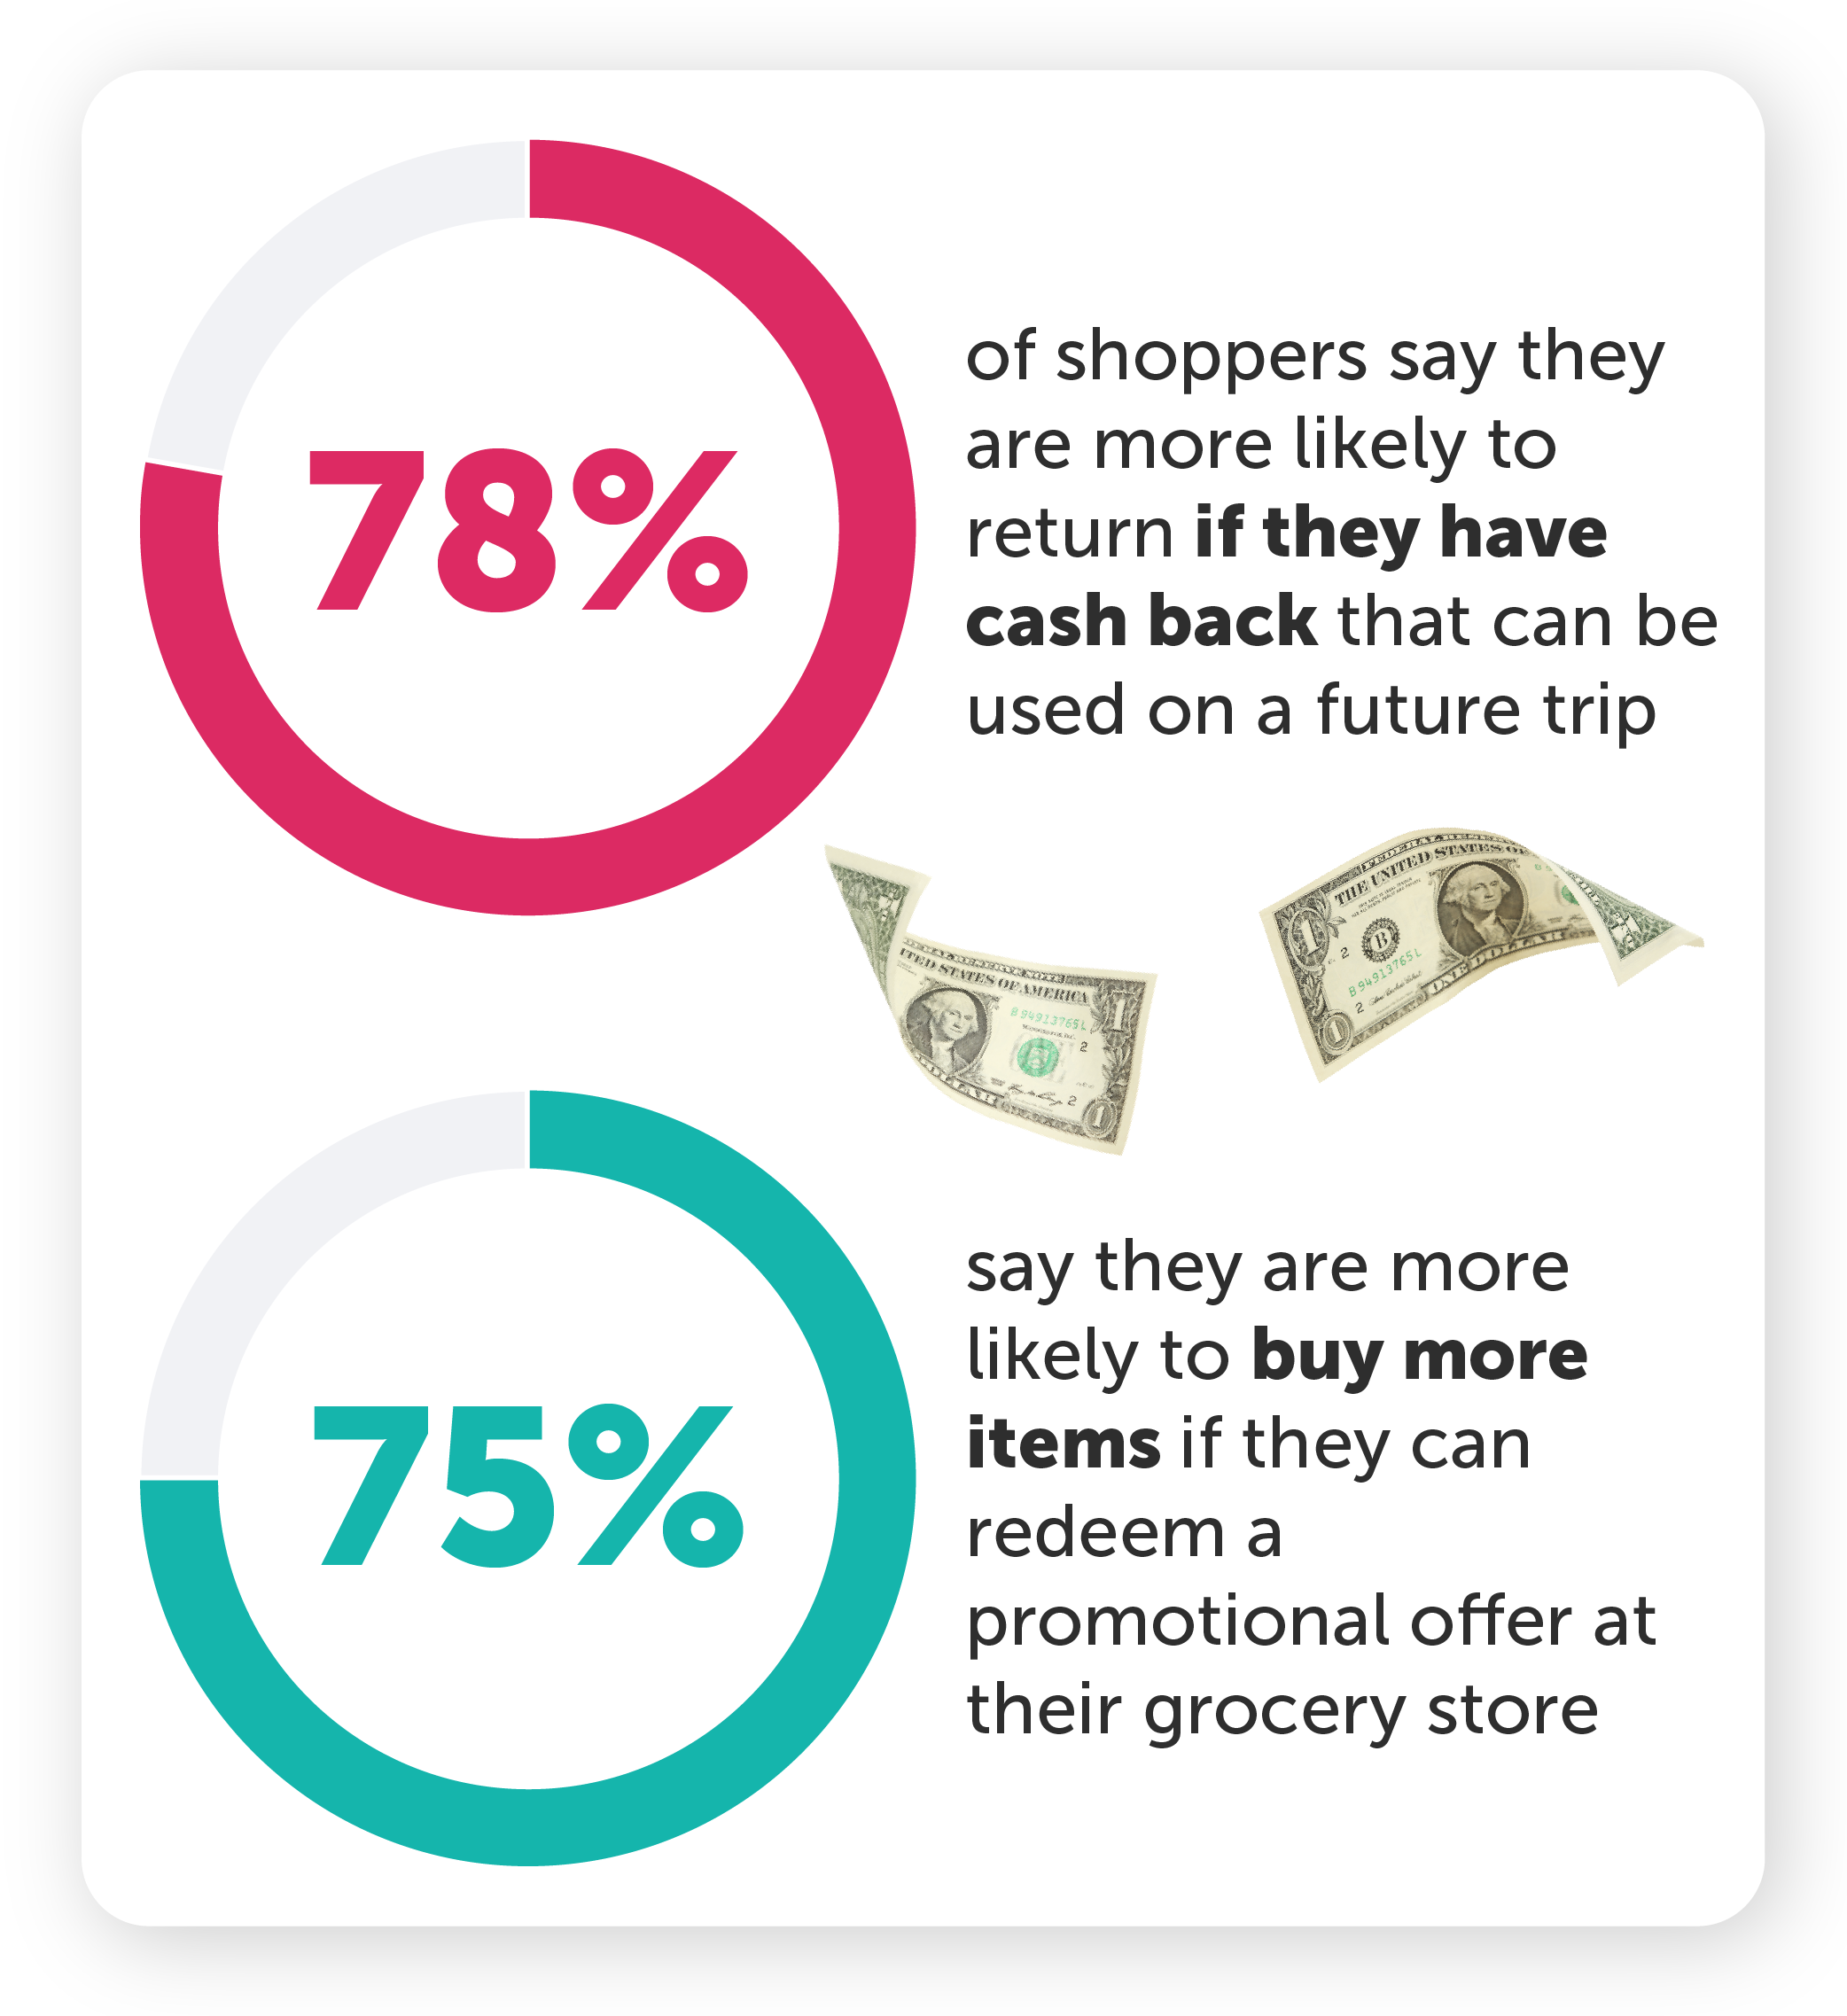
When it comes to trying something new, price is the deciding factor for most consumers, with 64% agreeing price is more important than the brand name. And assuming quality is equal, 75% of consumers will try a different brand when offered at a lower price. This means brands have an opportunity to encourage trial by utilizing competitive pricing and promotional strategies.
Of the consumers we surveyed, 64% say that the last time they tried a new product they did so because of a price-related reason. But although price remains a key driver for encouraging initial trial, the discovery phase is multifaceted. In-store browsing remains the dominant way consumers encounter new products, but store displays, friends or family, and digital offers also play significant roles for at least one-third of shoppers. For brands that really want to stand out, a great price alone isn’t enough.
What’s driving consumer loyalty?
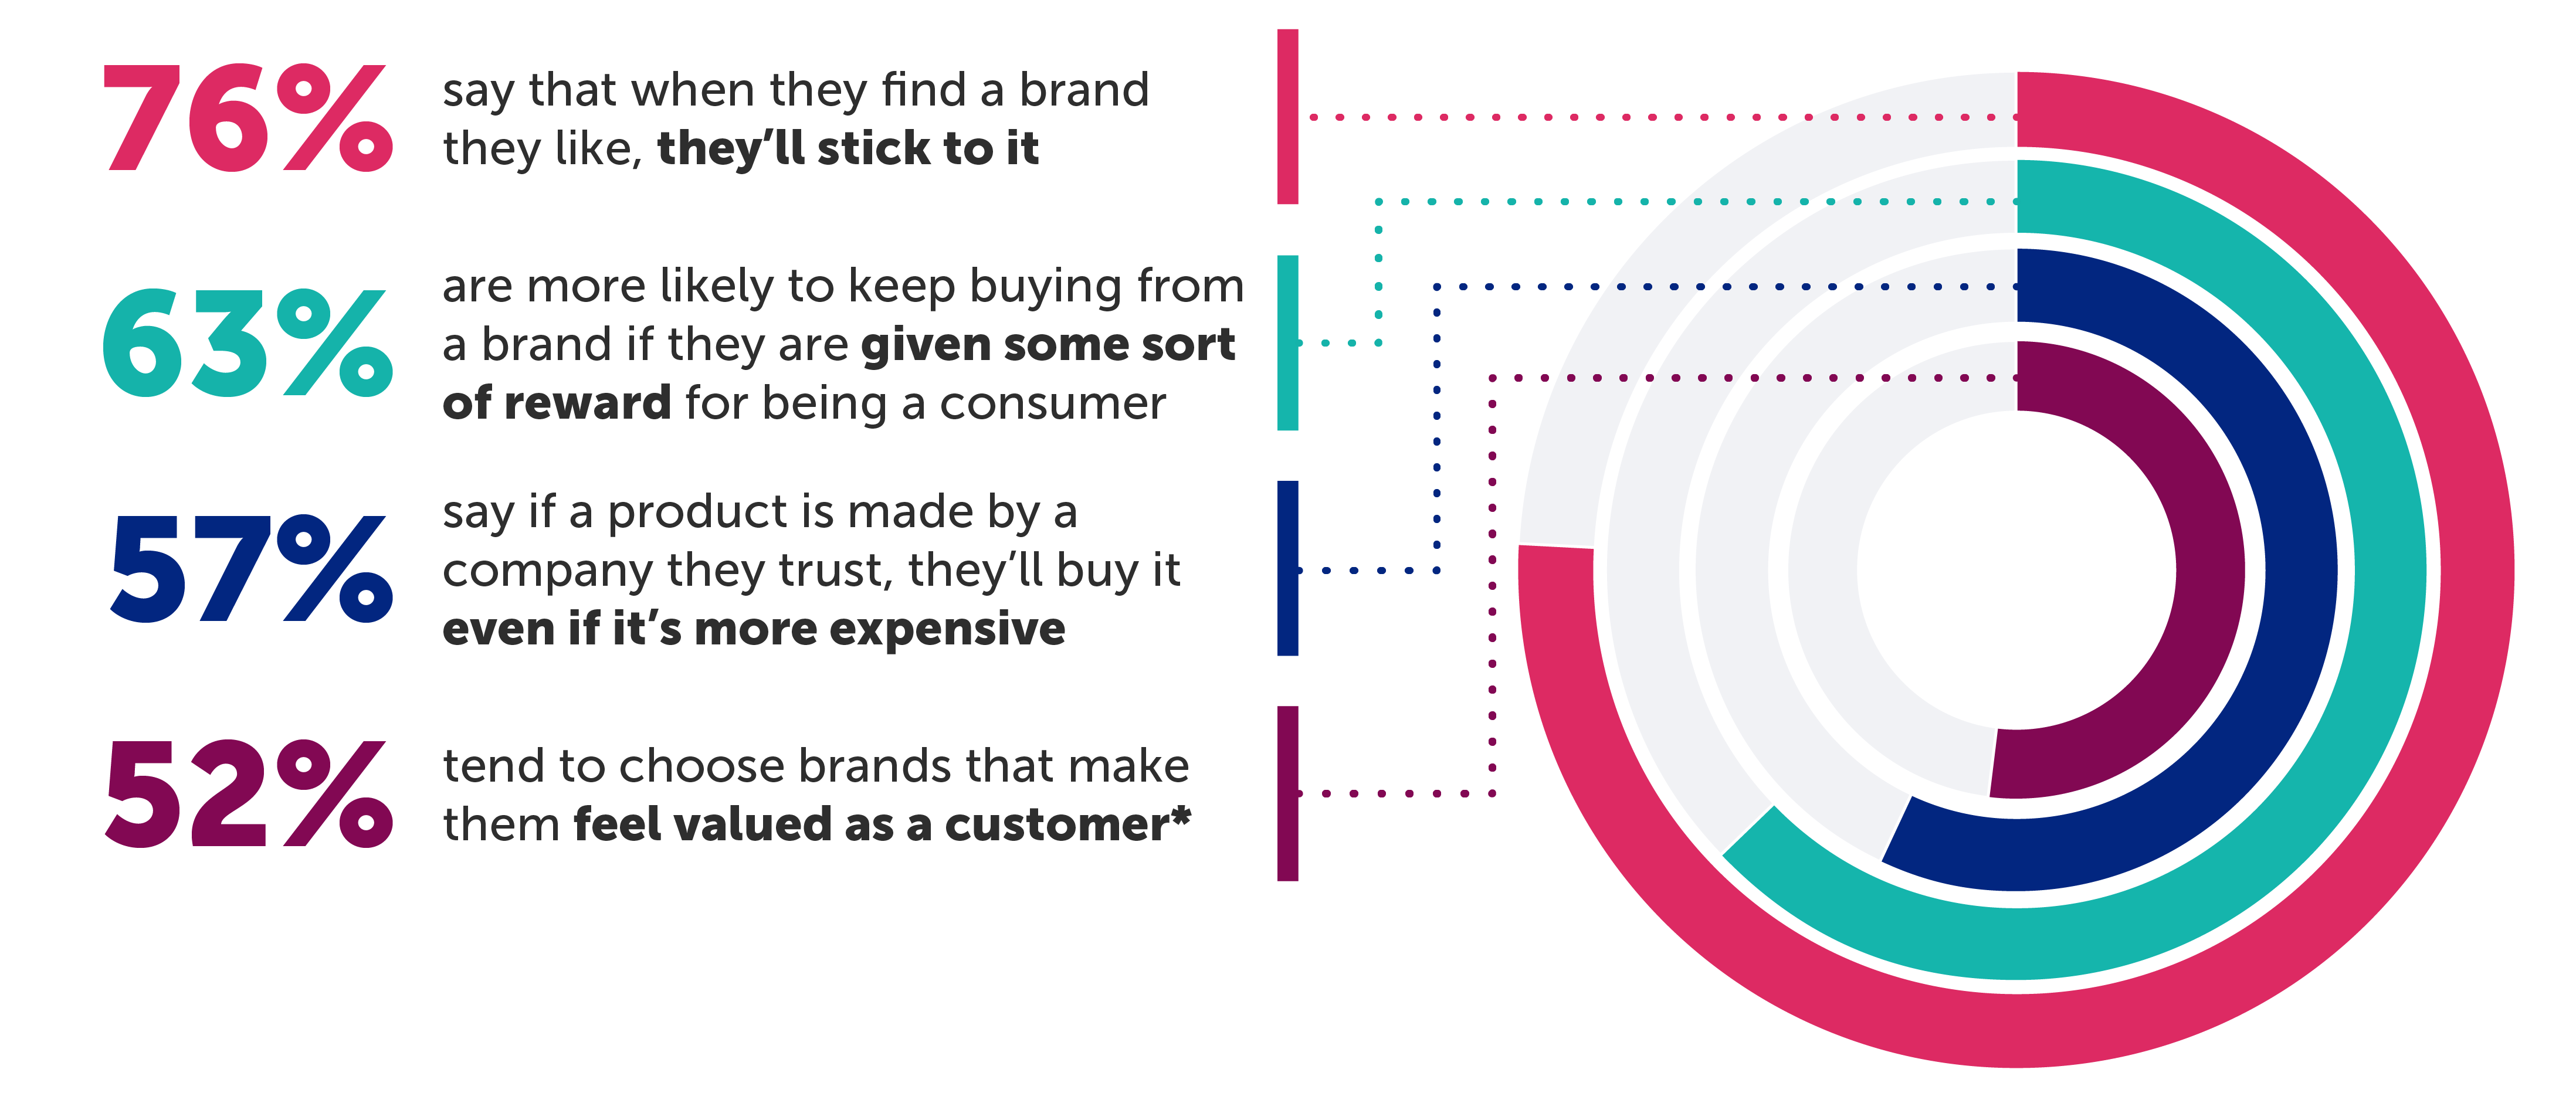
Beyond the initial purchase and trial, creating brand affinity and building consumer trust are crucial for driving repeat business and fostering brand loyalty. Once a shopper has found a brand they like, the majority will stick with it, driving home the importance of both customer acquisition and retention.
In order to keep their business, shoppers want to feel valued as customers — better yet, they want to be rewarded for their purchases. And once they’ve established trust in a brand, consumers are more likely to keep buying their products, even if they’re more expensive.
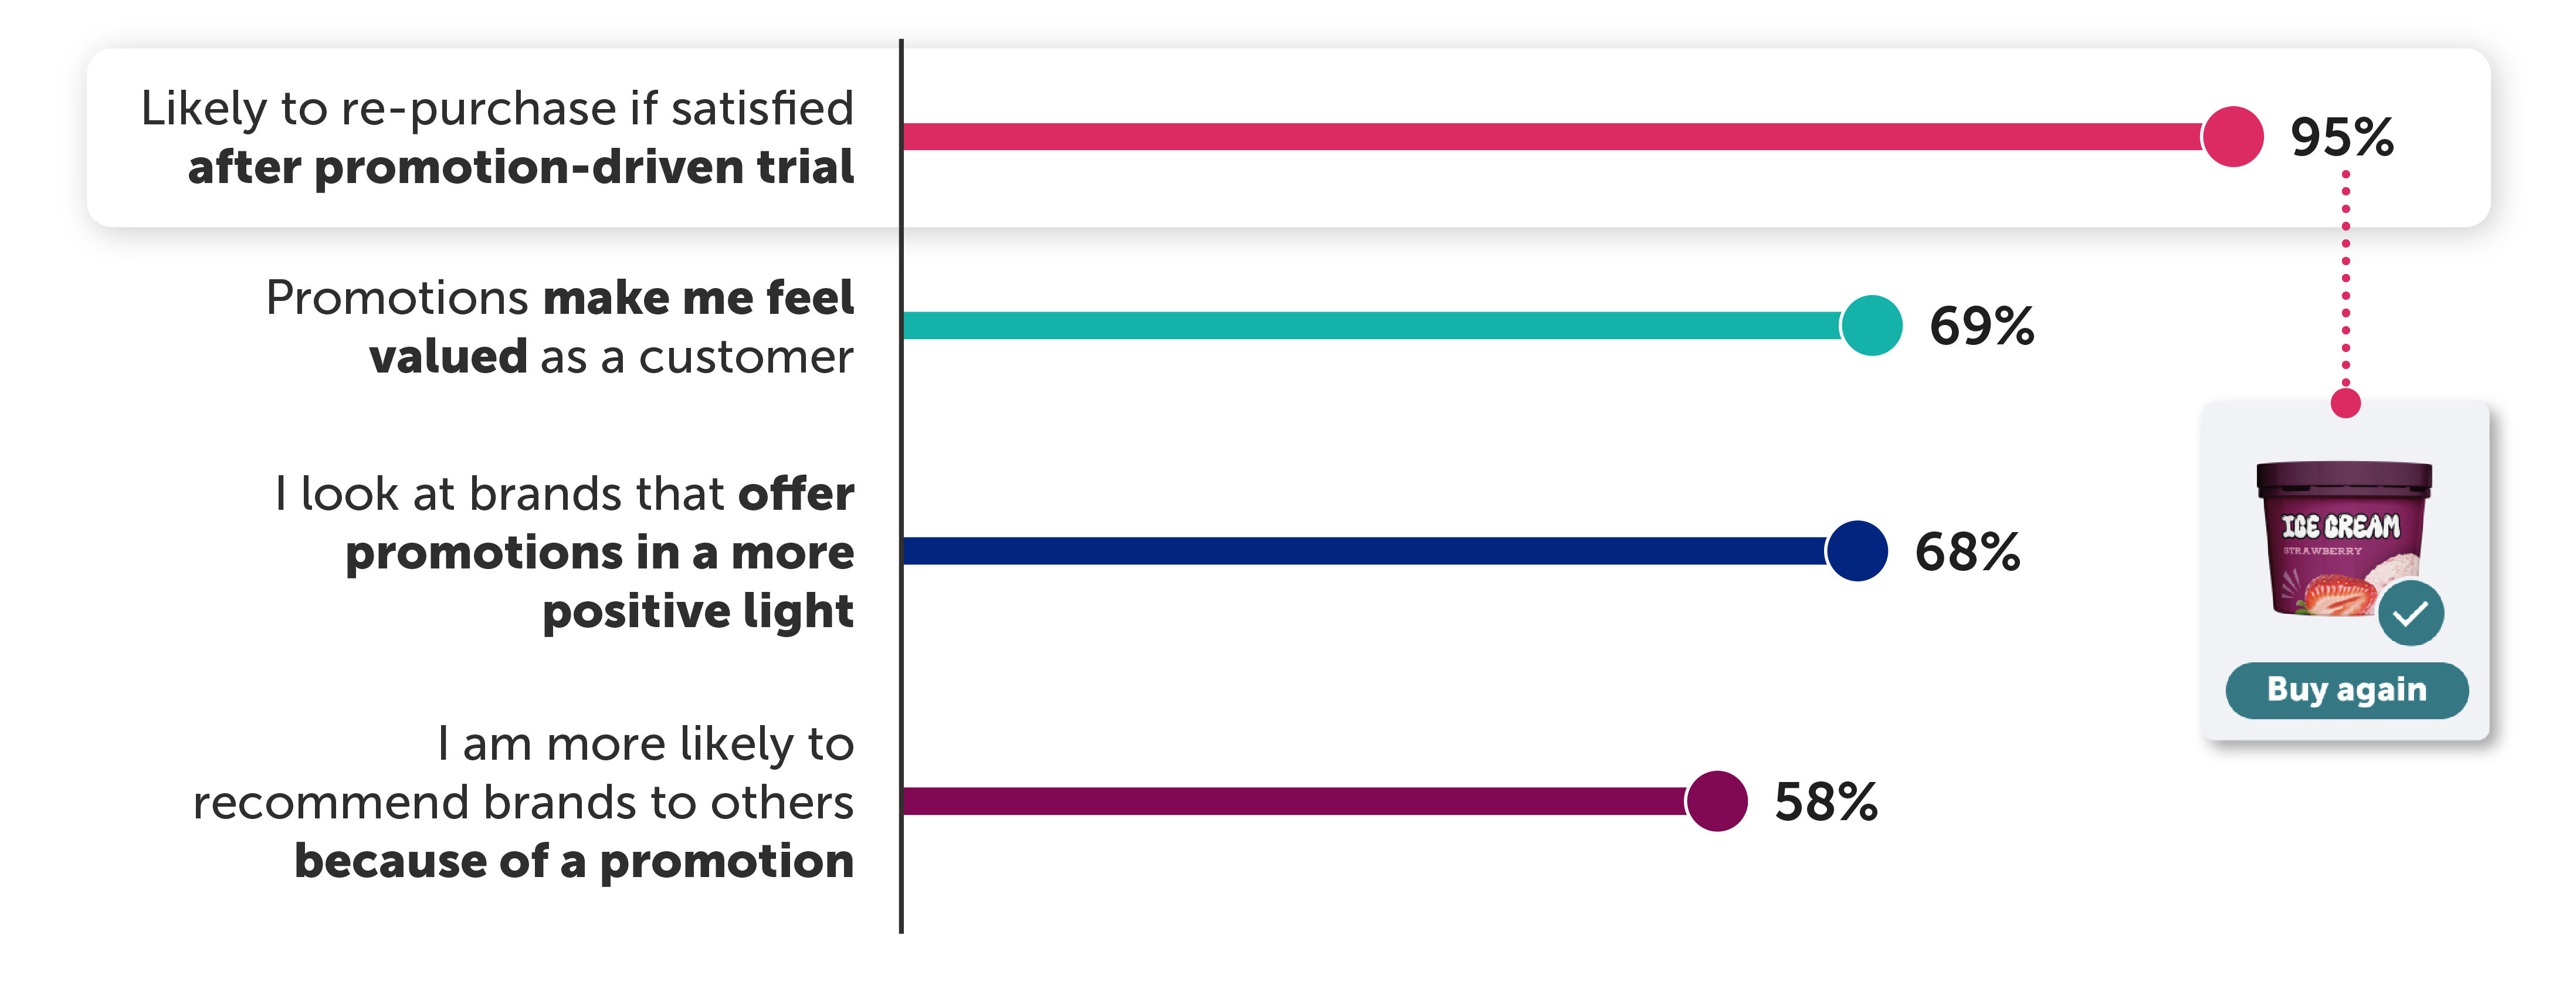
Promotions create this sense of value that consumers expect, fostering positive associations and affinity that can influence the entire consumer journey, from initial trial to retention and even to evangelism. Of the consumers we surveyed, 76% say promotions make them think a brand is more valuable as opposed to cheapening it.
Marketers, on the other hand, underestimate the positive impact promotions have on brand value in the eyes of consumers. When asked about consumers’ perceptions of promotions, 64% of marketers say promotions make consumers think a brand is valuable and 36% say promotions make consumers think a brand is cheap. This is in stark contrast to consumers’ actual beliefs about promotions, which are overwhelmingly positive.
How promotions influence where consumers shop
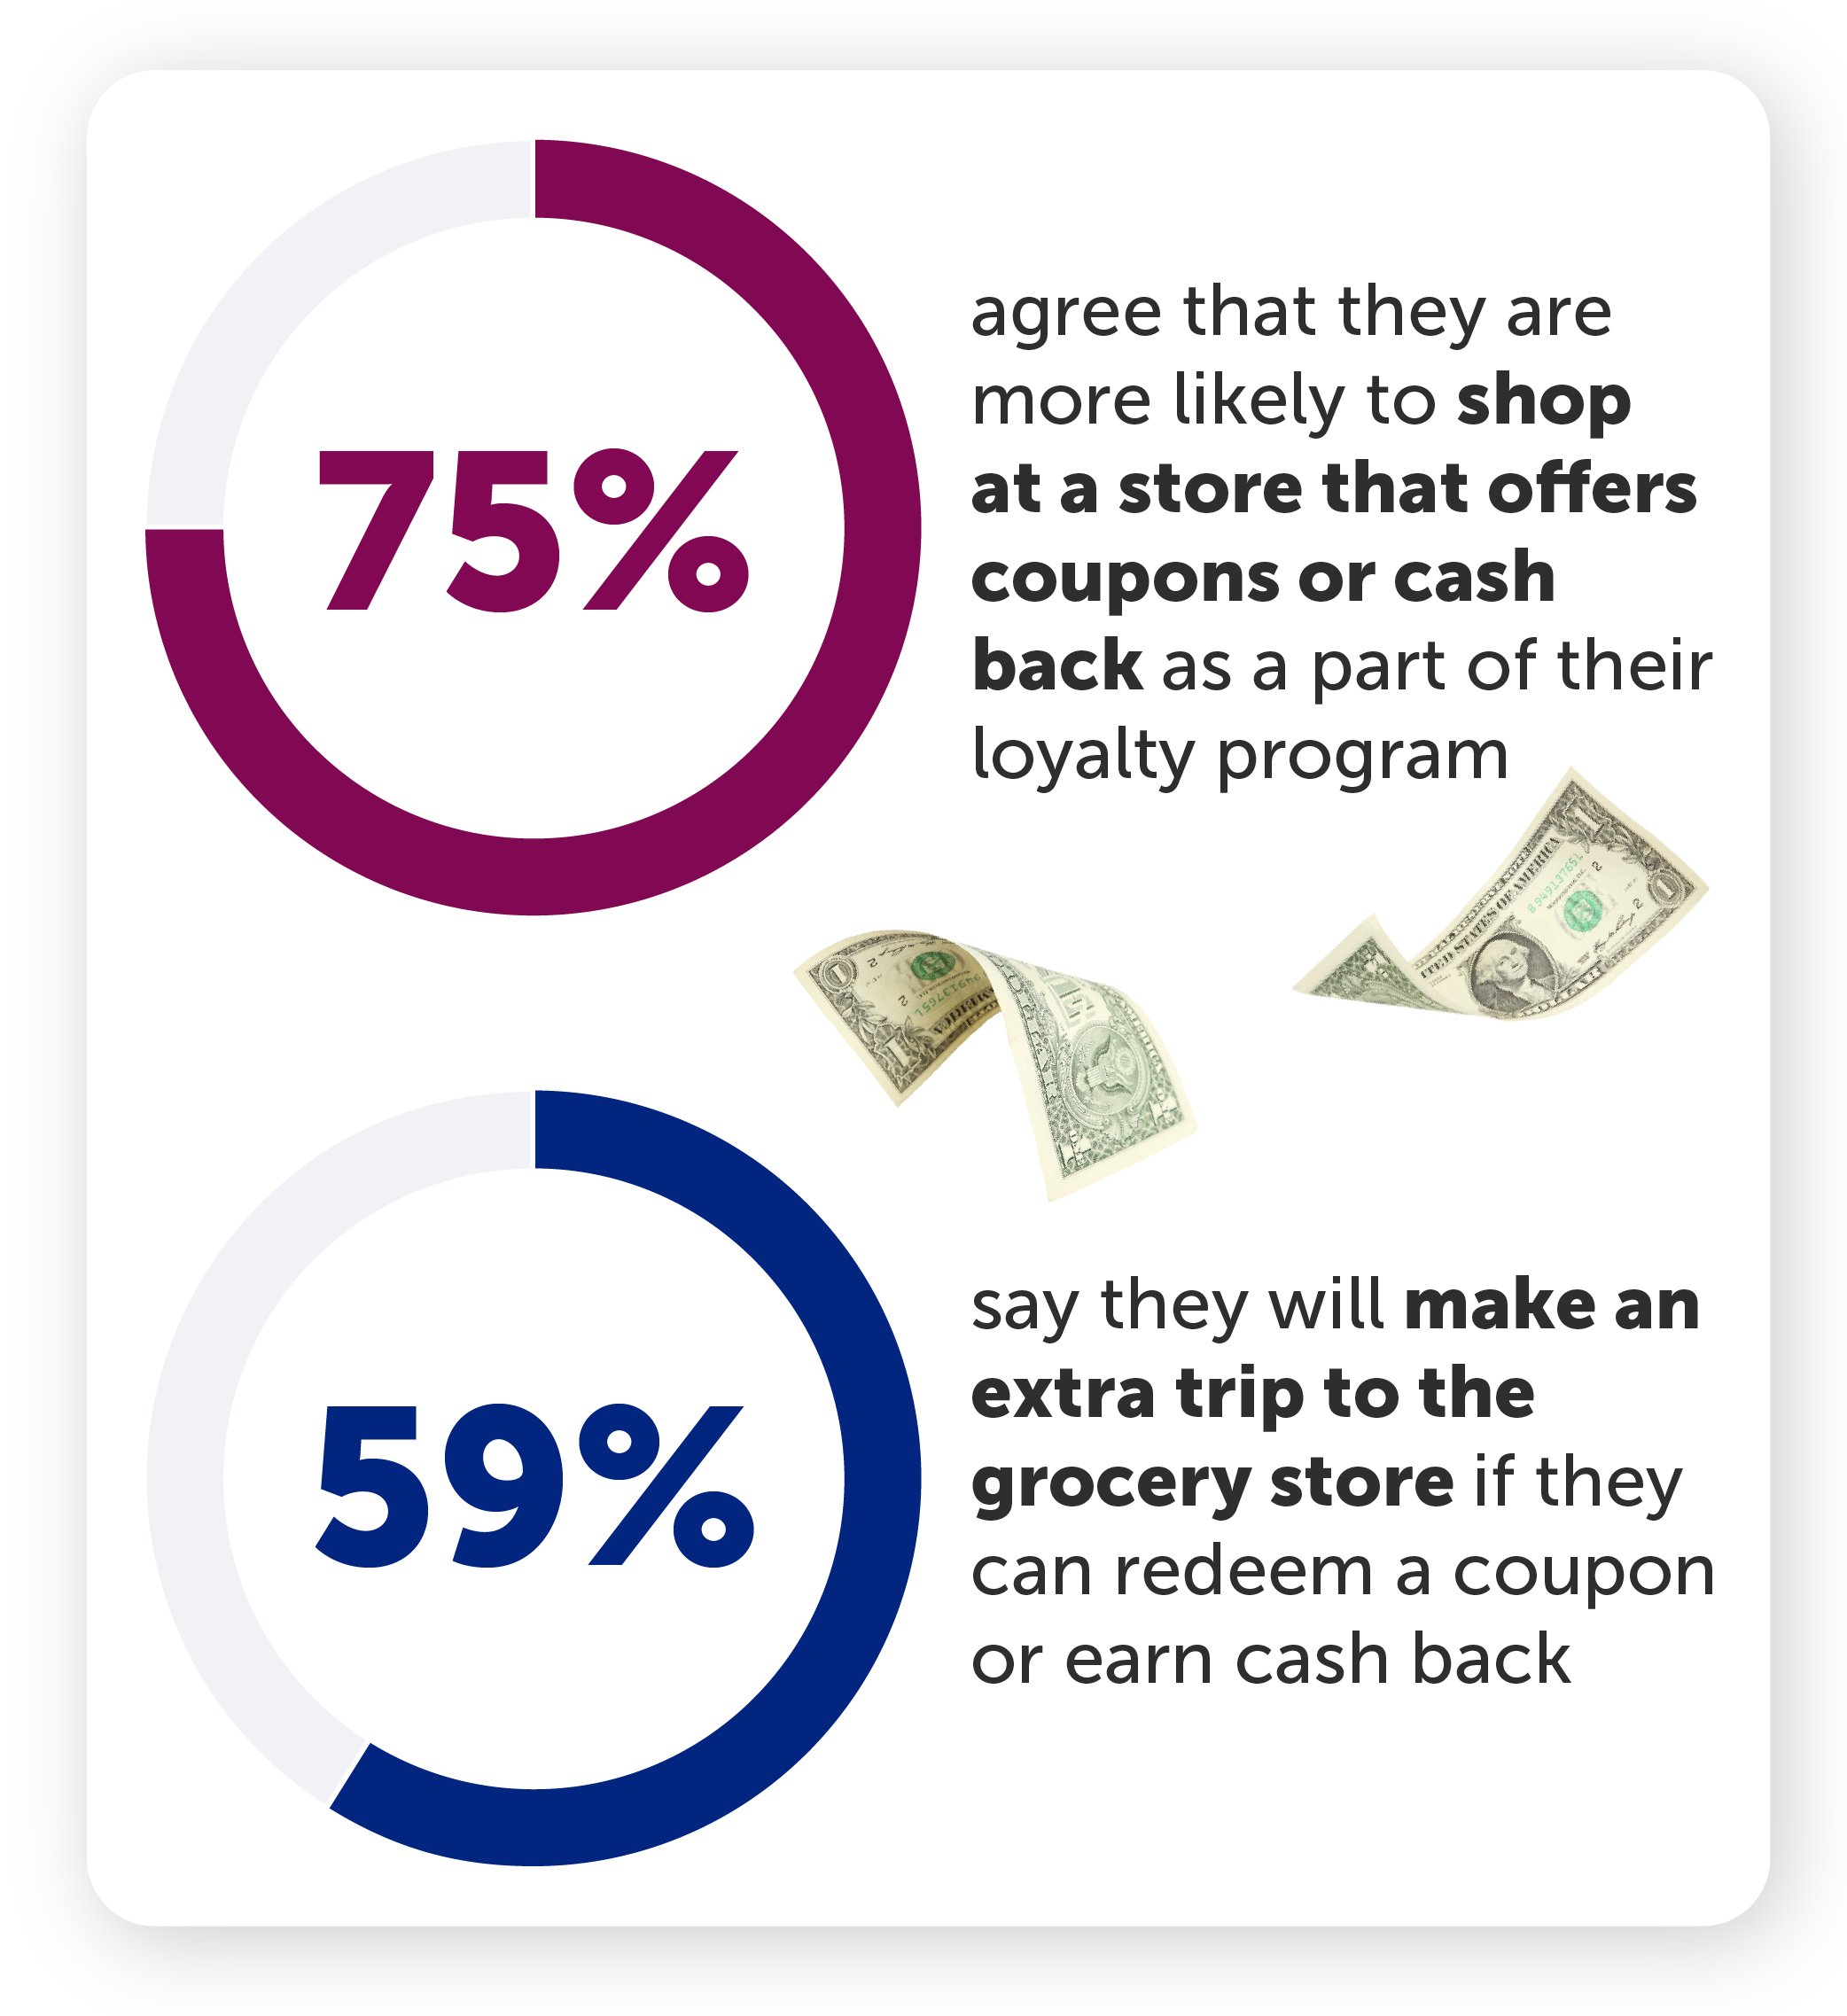
Promotions don’t just influence what consumers buy — they also influence where those consumers shop. The presence of a rewards or loyalty program is the No. 1 deciding factor for shoppers when choosing a grocery store.
By offering promotional rewards, grocery stores and retailers can tap into shoppers' desires for value, driving repeat business, encouraging them to spend more, and bringing them into the store more often.
Comparing promotional tactics: Coupons vs. cash back
When it comes to the ways shoppers want to be rewarded, our research looked at two key tactics — coupons and cash back — to better understand the impact these types of promotions have on shopper behavior. When presented with a choice, 45% of consumers prefer cash back and 55% prefer coupons. The relatively marginal difference suggests that consumers are prioritizing savings opportunities in general, regardless of form. However, these tactics have their differences.
Coupons have been around for well over a hundred years, and consumers have long been accustomed to leveraging them as a savings strategy. So it’s no surprise that 61% of consumers still expect brands to provide this type of offer. And when it comes to volume, coupons still hold a slight edge over cash back, with 54% of consumers saying that coupons have led them to buy more of an item than they normally would have.
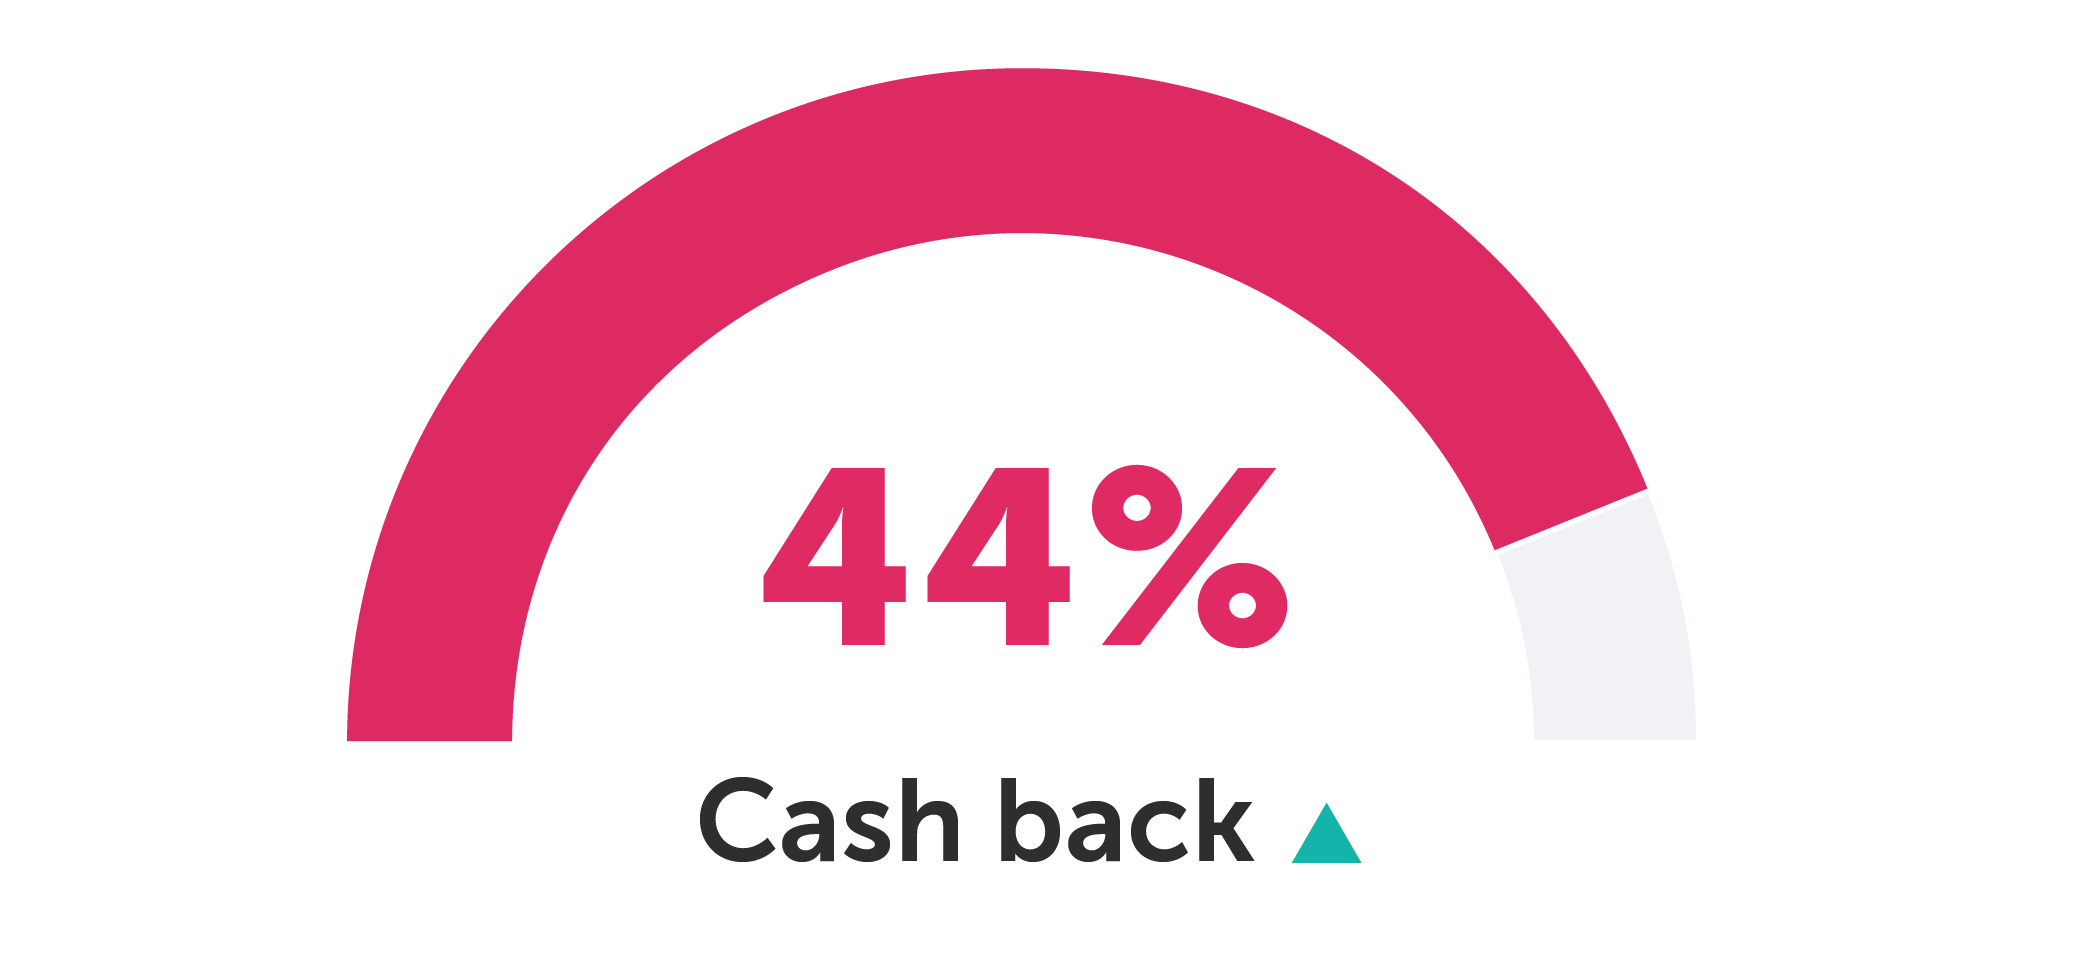
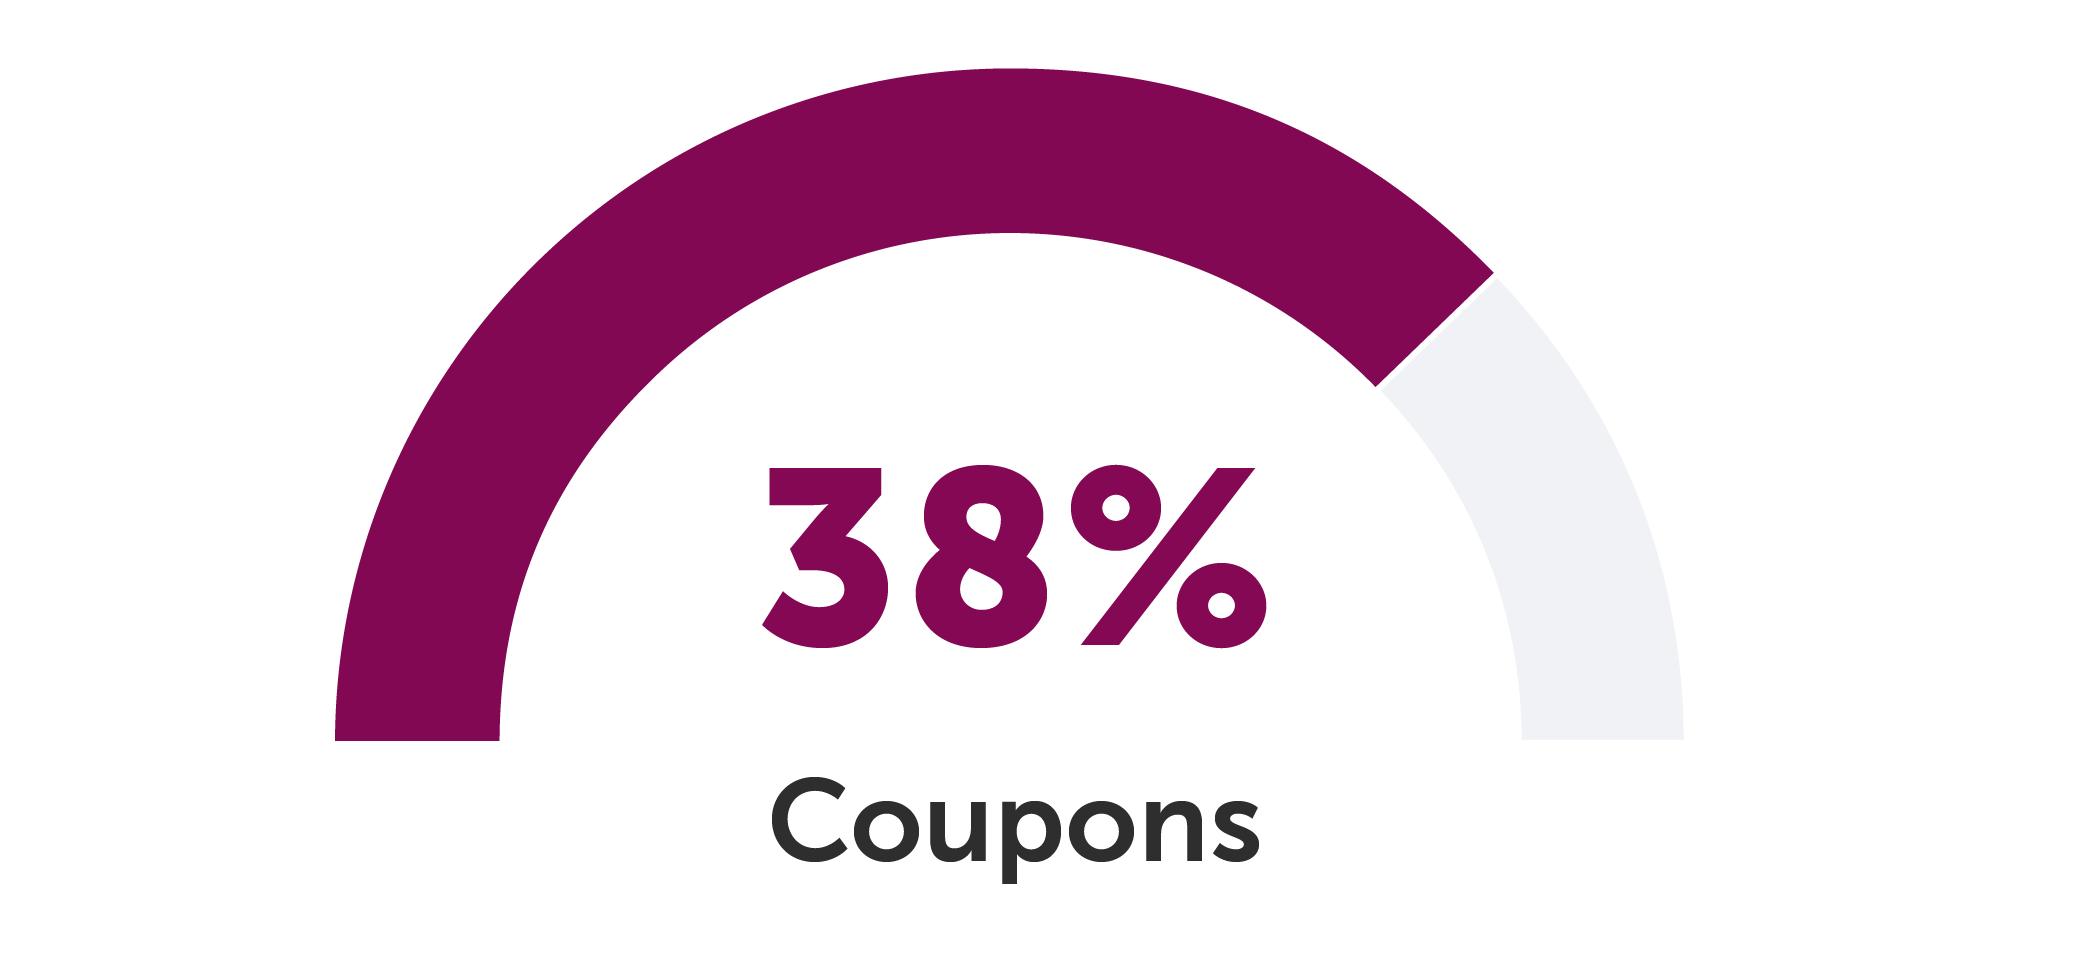
Yet while consumers may have a preference for coupons, cash-back offers actually have a stronger ability to counter shoppers’ existing habits and brand loyalties. Of the consumers we surveyed, 44% say they tried a new brand in the past month as a direct result of cash back — outpacing coupons by 6%.
Tried a new brand in the past month as a direct result of...
Cash back has other notable benefits for brands, driving positive brand perceptions as well as brand advocacy. In fact, 71% of consumers say cash-back offers make them feel valued as a customer and view that brand in a more positive light. Additionally, 61% of consumers say they’re likely to recommend a brand to others because of an offer. And considering 37% of shoppers discover items they’ve bought for the first time through friends and family, this kind of word-of-mouth promotion can be invaluable.
Cash-back rewards can also add excitement and delight to the shopping experience. Seventy percent of consumers say that cash back makes grocery shopping fun, and 67% say they provide a way to treat themselves. This presents a valuable opportunity to create positive associations and foster lasting brand or retailer affinity.
For retailers, cash back can be a boon for driving repeat trips to their stores, which is critical at a time when store trips are decreasing. When shoppers have earnings that can be used on a future purchase, 78% say they’re more likely to return to a store, giving cash back a 5% lead over coupons.
Yet regardless of offer type, consumers are clear in their expectations. They want savings on everyday items — things they already buy and that are relevant to their needs — and they want the redemption process to be clear and simple. The more transparent brands can be about the terms of redemption and the more they can personalize savings to individual shoppers, the more successful their cash-back programs will be.
How marketers are prioritizing promotional strategies & spend
This year, marketers are prioritizing strategies that help them build up their brand and cultivate long-term customer relationships. This is reflected in how they measure the success of marketing initiatives, with incremental sales and customer lifetime value ranking as the two most important success metrics for 70% and 68% of marketers, respectively. These measurements beat out other metrics such as market share, payback period, and customer acquisition cost.
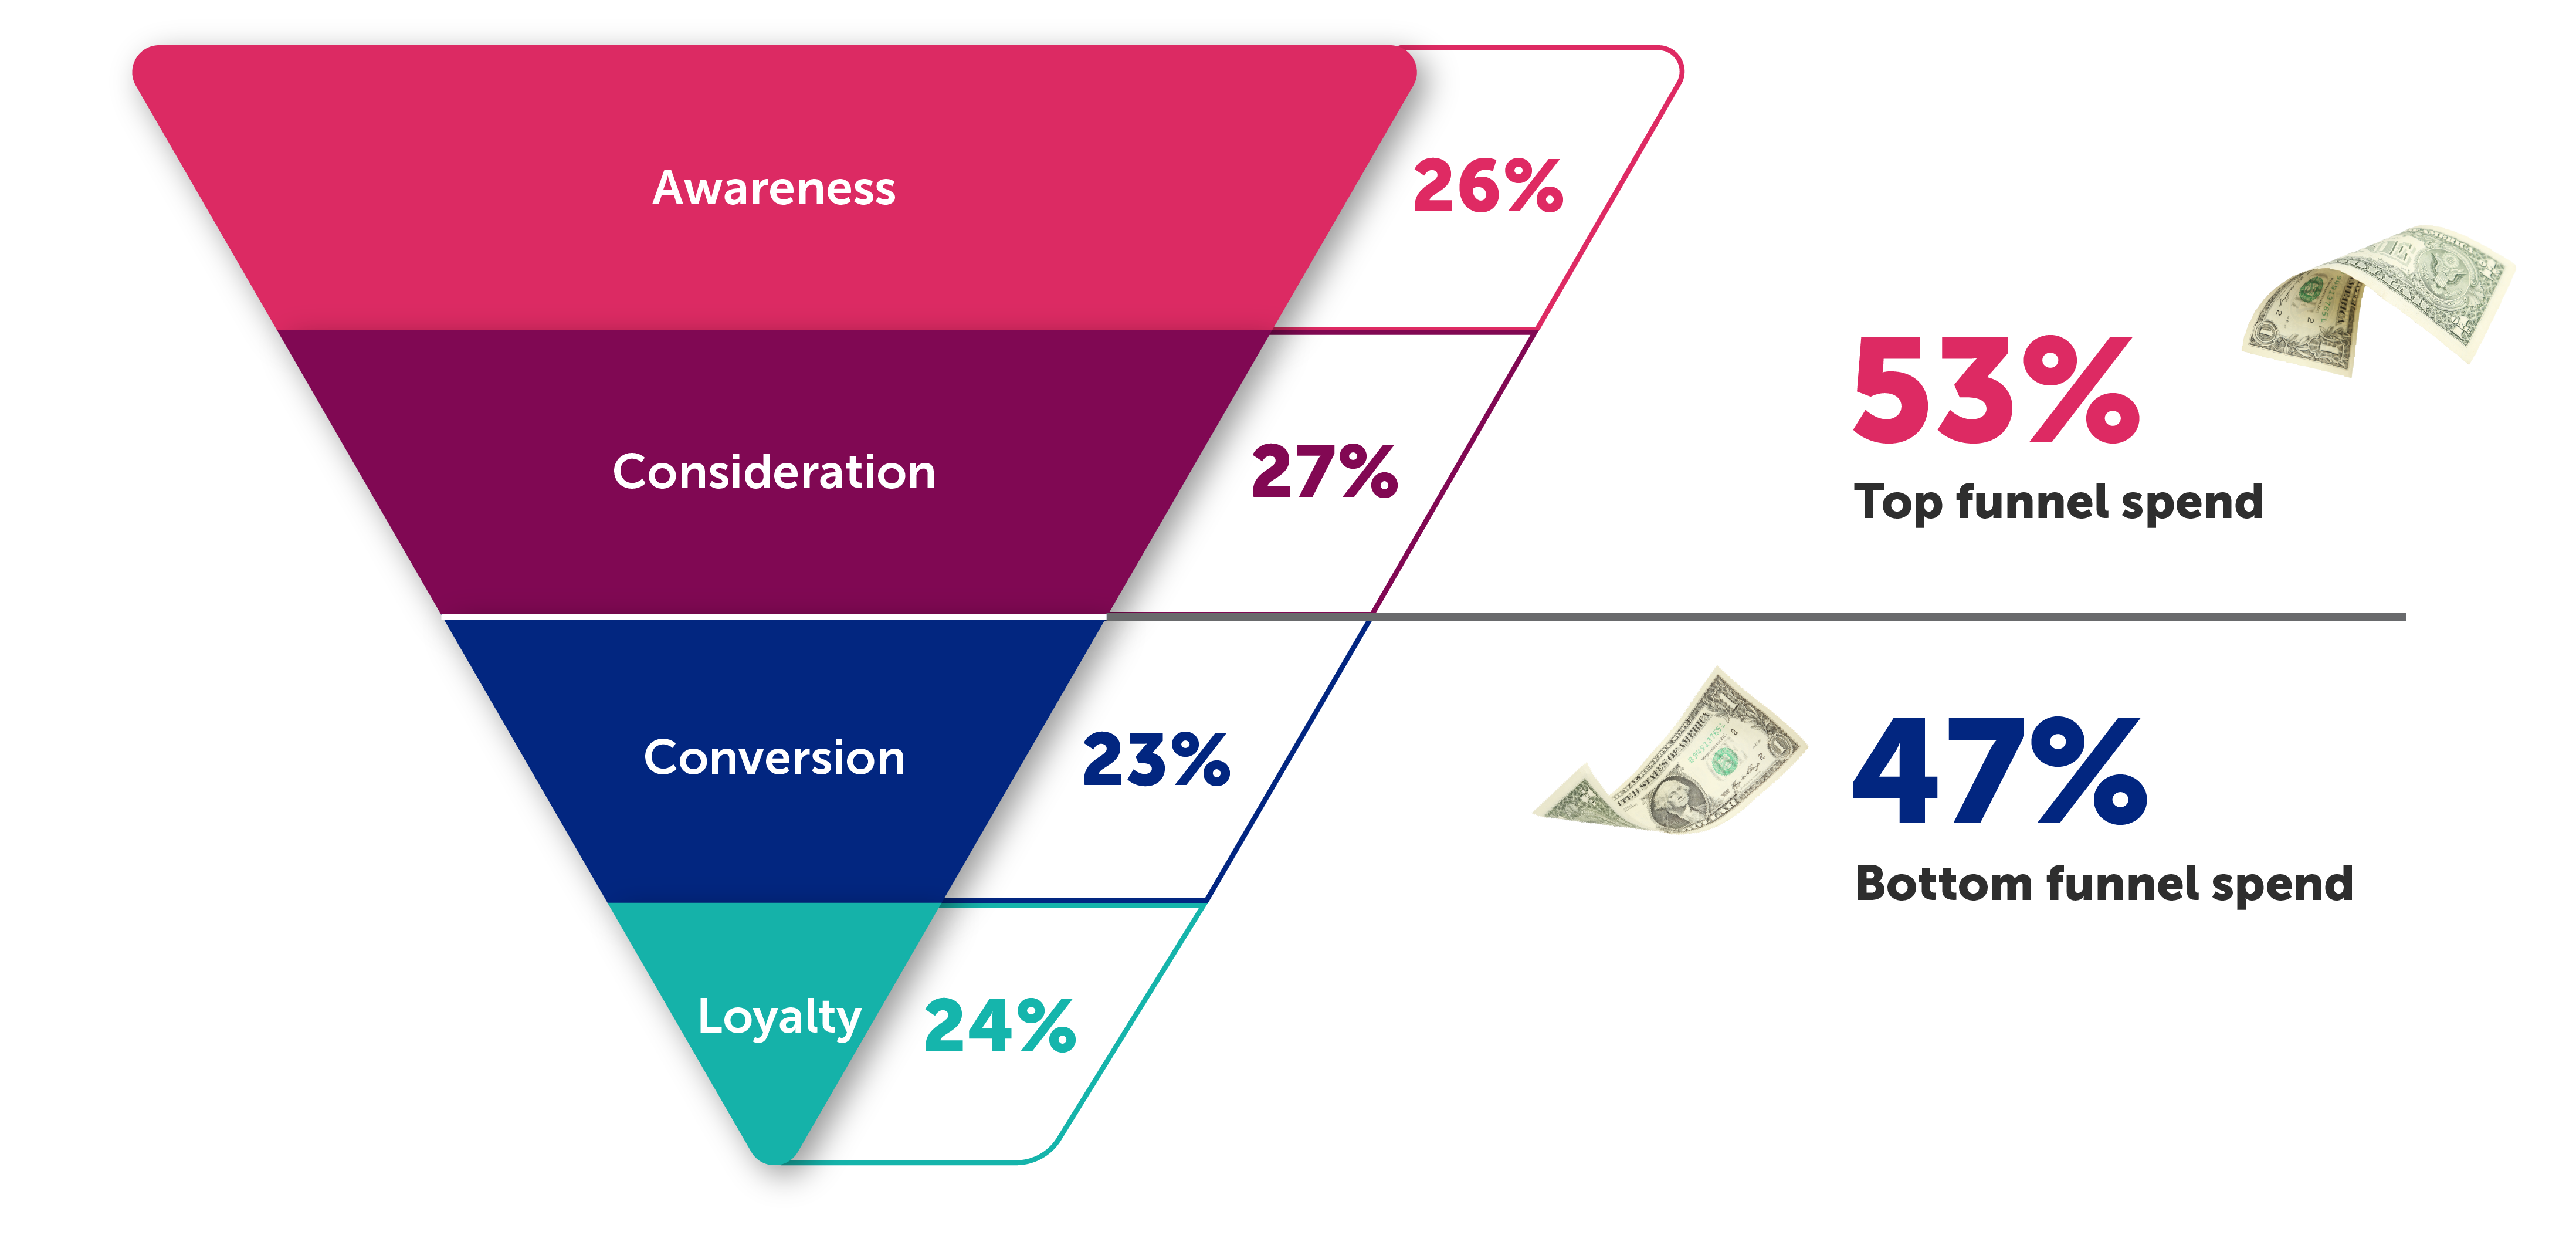
This shift is also reflected in stated priorities and budget allocations, with a transition away from conversion-related focus and spending. Looking at the stages of the marketing funnel, awareness and consideration were the most important strategic focuses for 64% of marketers. Awareness, in particular, saw an 8% increase from 2023. And while conversions and loyalty were the most important focuses for only 36% of marketers, loyalty saw a 10% increase in importance year over year. Conversions, however, saw an 18% decrease in importance.
This decreased priority placed on immediate conversions is also reflected in budget allocation, where there is a directional shift away from conversion-related spending this year. Yet despite these shifts, budget allocation remains relatively evenly distributed across each stage of the funnel. This indicates that, while marketers are placing greater emphasis on top-of-funnel strategies, they’re still investing across the full funnel.
When asked to choose what is more important this year, two-thirds of marketers say bringing new customers on board is their top priority. While only 33% say retaining their current customers is more important. This strategic emphasis on customer acquisition, brand-building, and long-term growth may be driven in part by the threat of private labels.
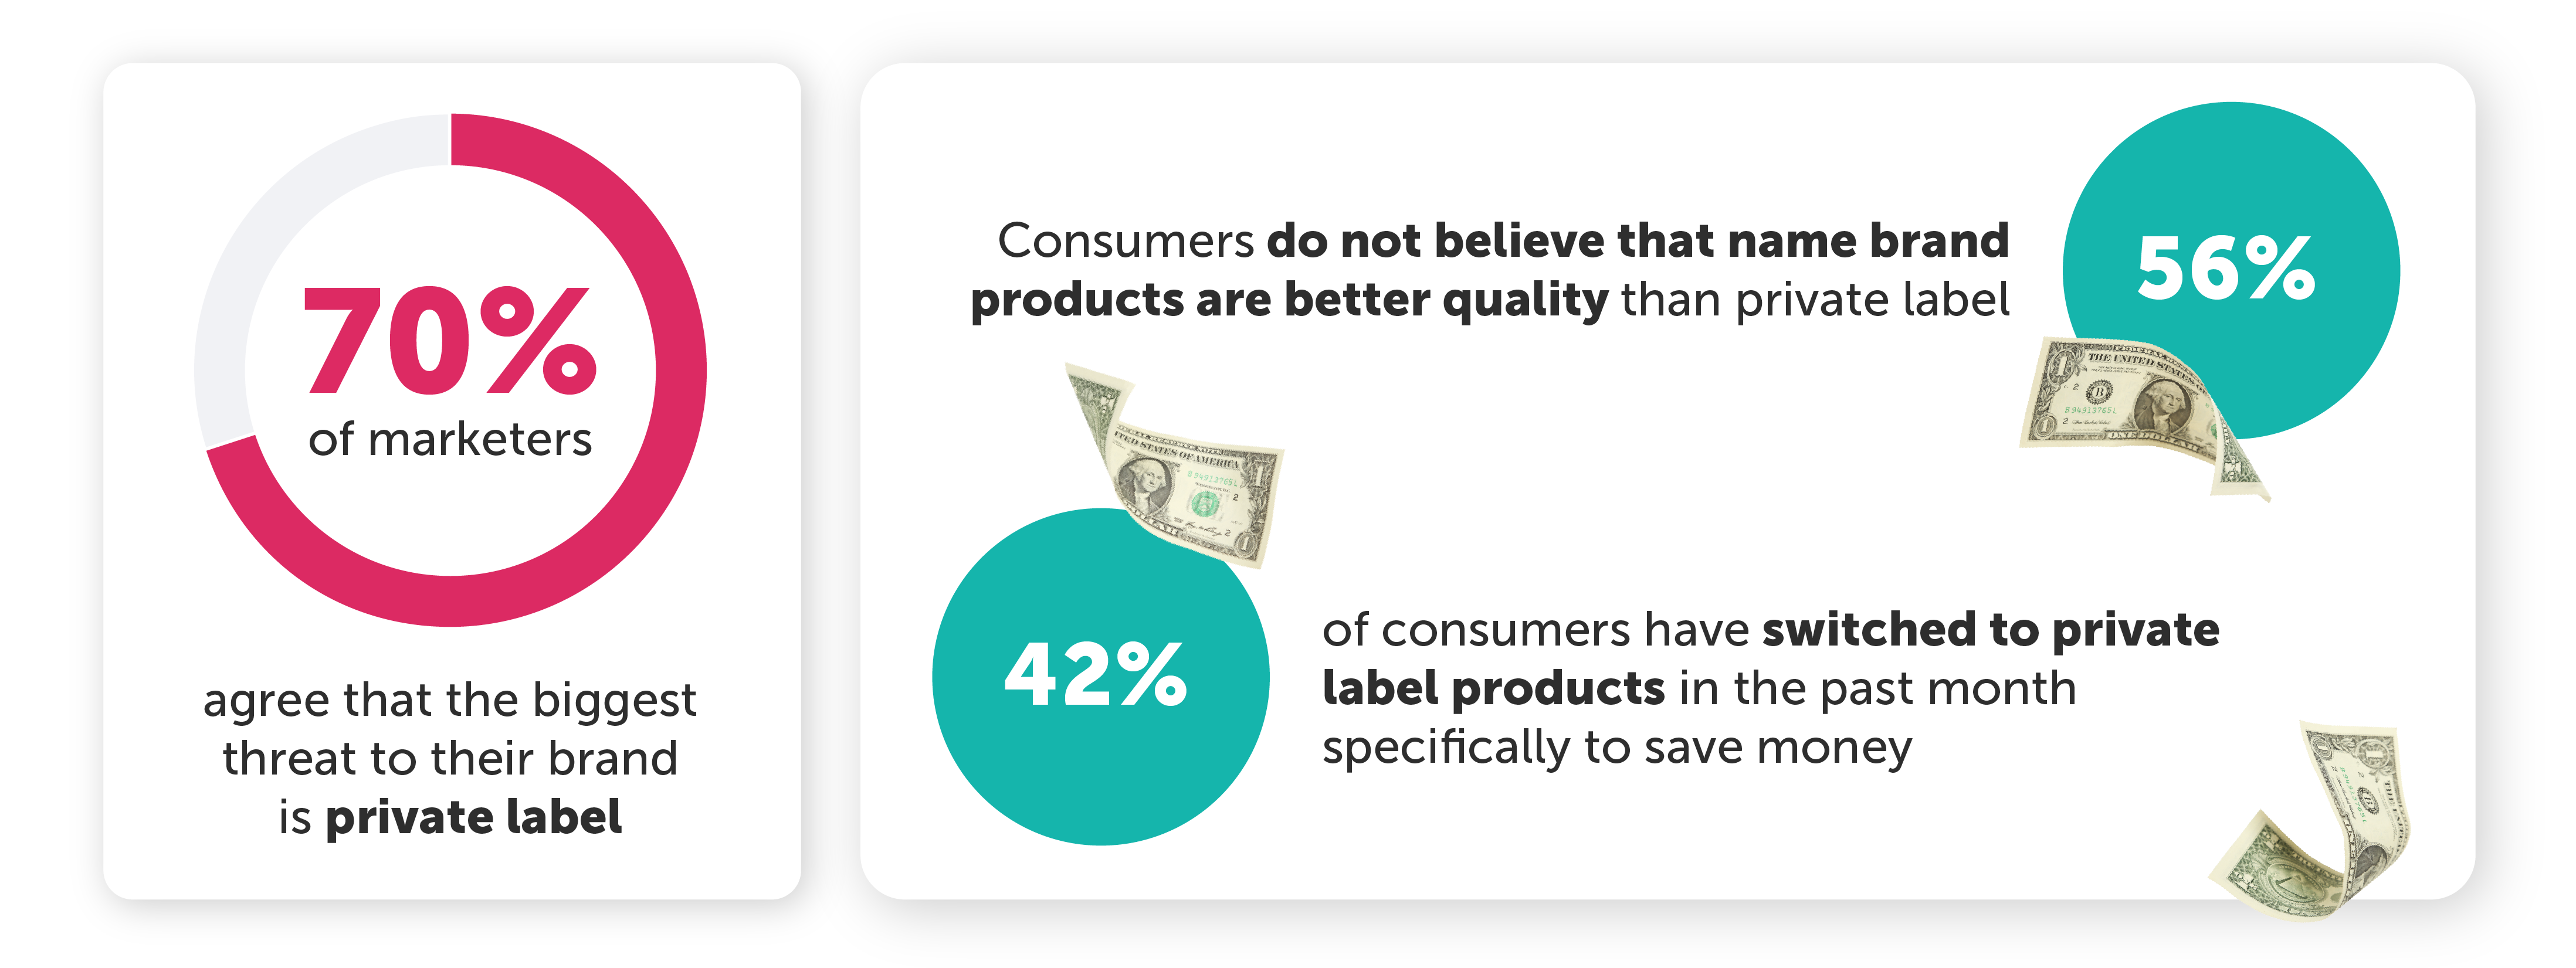
The majority of consumers don’t believe there’s a difference in quality between brand name and private label products, and 43% have switched to a private label product to save money in the last month. In fact, private-label switching is the third most common way shoppers are saving money right now. As private labels continue to grow their market share, many brands are feeling compelled to focus on their brand equity, differentiate their offerings, and proactively expand their customer base.
How marketers are investing in promotions in 2024 — and beyond
Digital strategies have become a critical part of any marketing plan, and investment in digital promotions continues to grow — particularly for brand-building. However, their full potential remains untapped. With the help of artificial intelligence and other innovative technologies, digital promotions are getting smarter and more personalized, which will undoubtedly lead to greater investments in the years to come.
This year, digital promotions lead spending growth across tactics, with a 13% year-over-year increase in use for early-stage engagement. The most common tactics marketers plan to utilize include digital promotions, social media marketing, and digital advertisements.
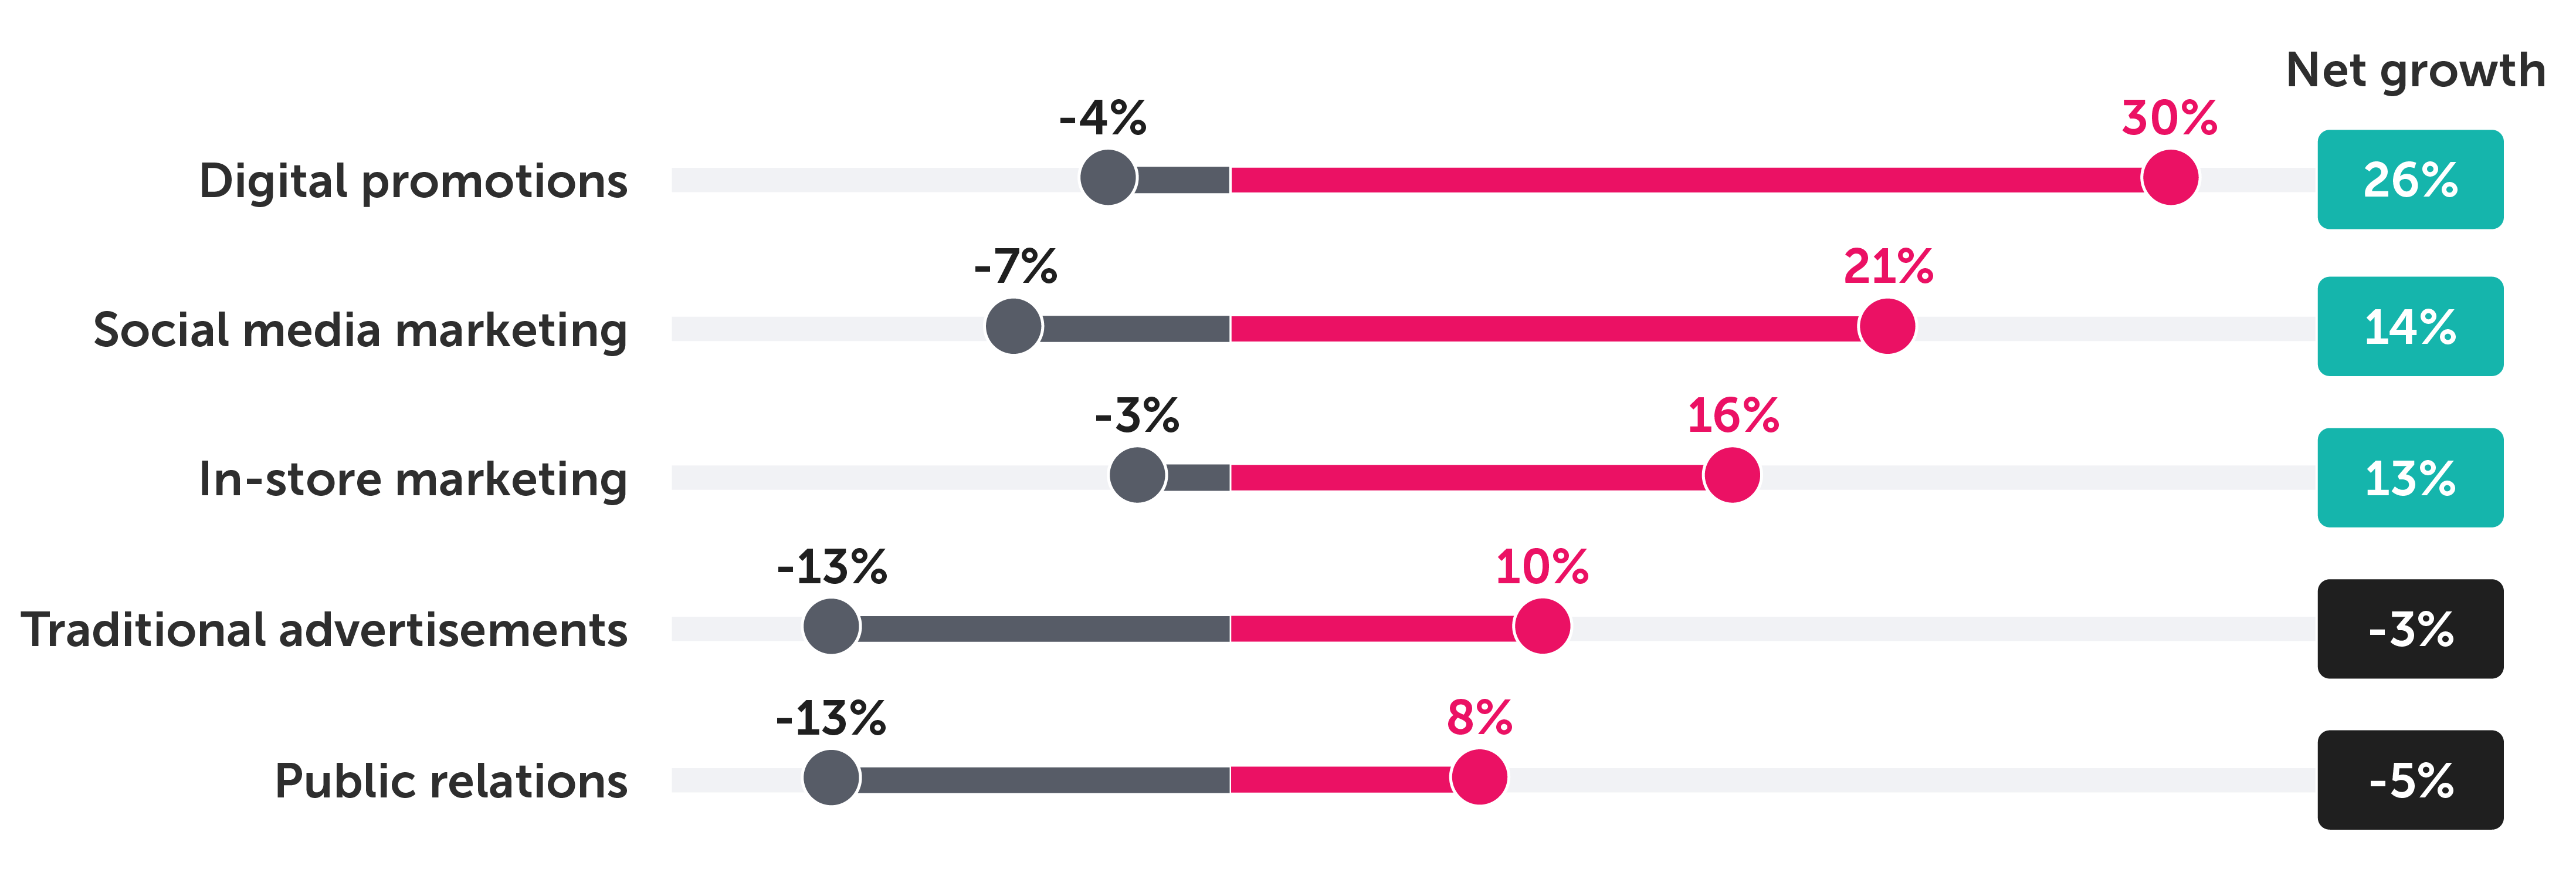
This represents a significant shift in the types of tactics marketers are using. In 2024, a net 26% of marketers are spending more on digital promotions than they were last year. Social media marketing and digital advertisements experienced notable increases as well, seeing a net growth of 14% and 9% in marketing spend, respectively. In-store marketing is also on the rise, with a net growth of 13%. The biggest net declines in marketing spend were for traditional advertisements and public relations.
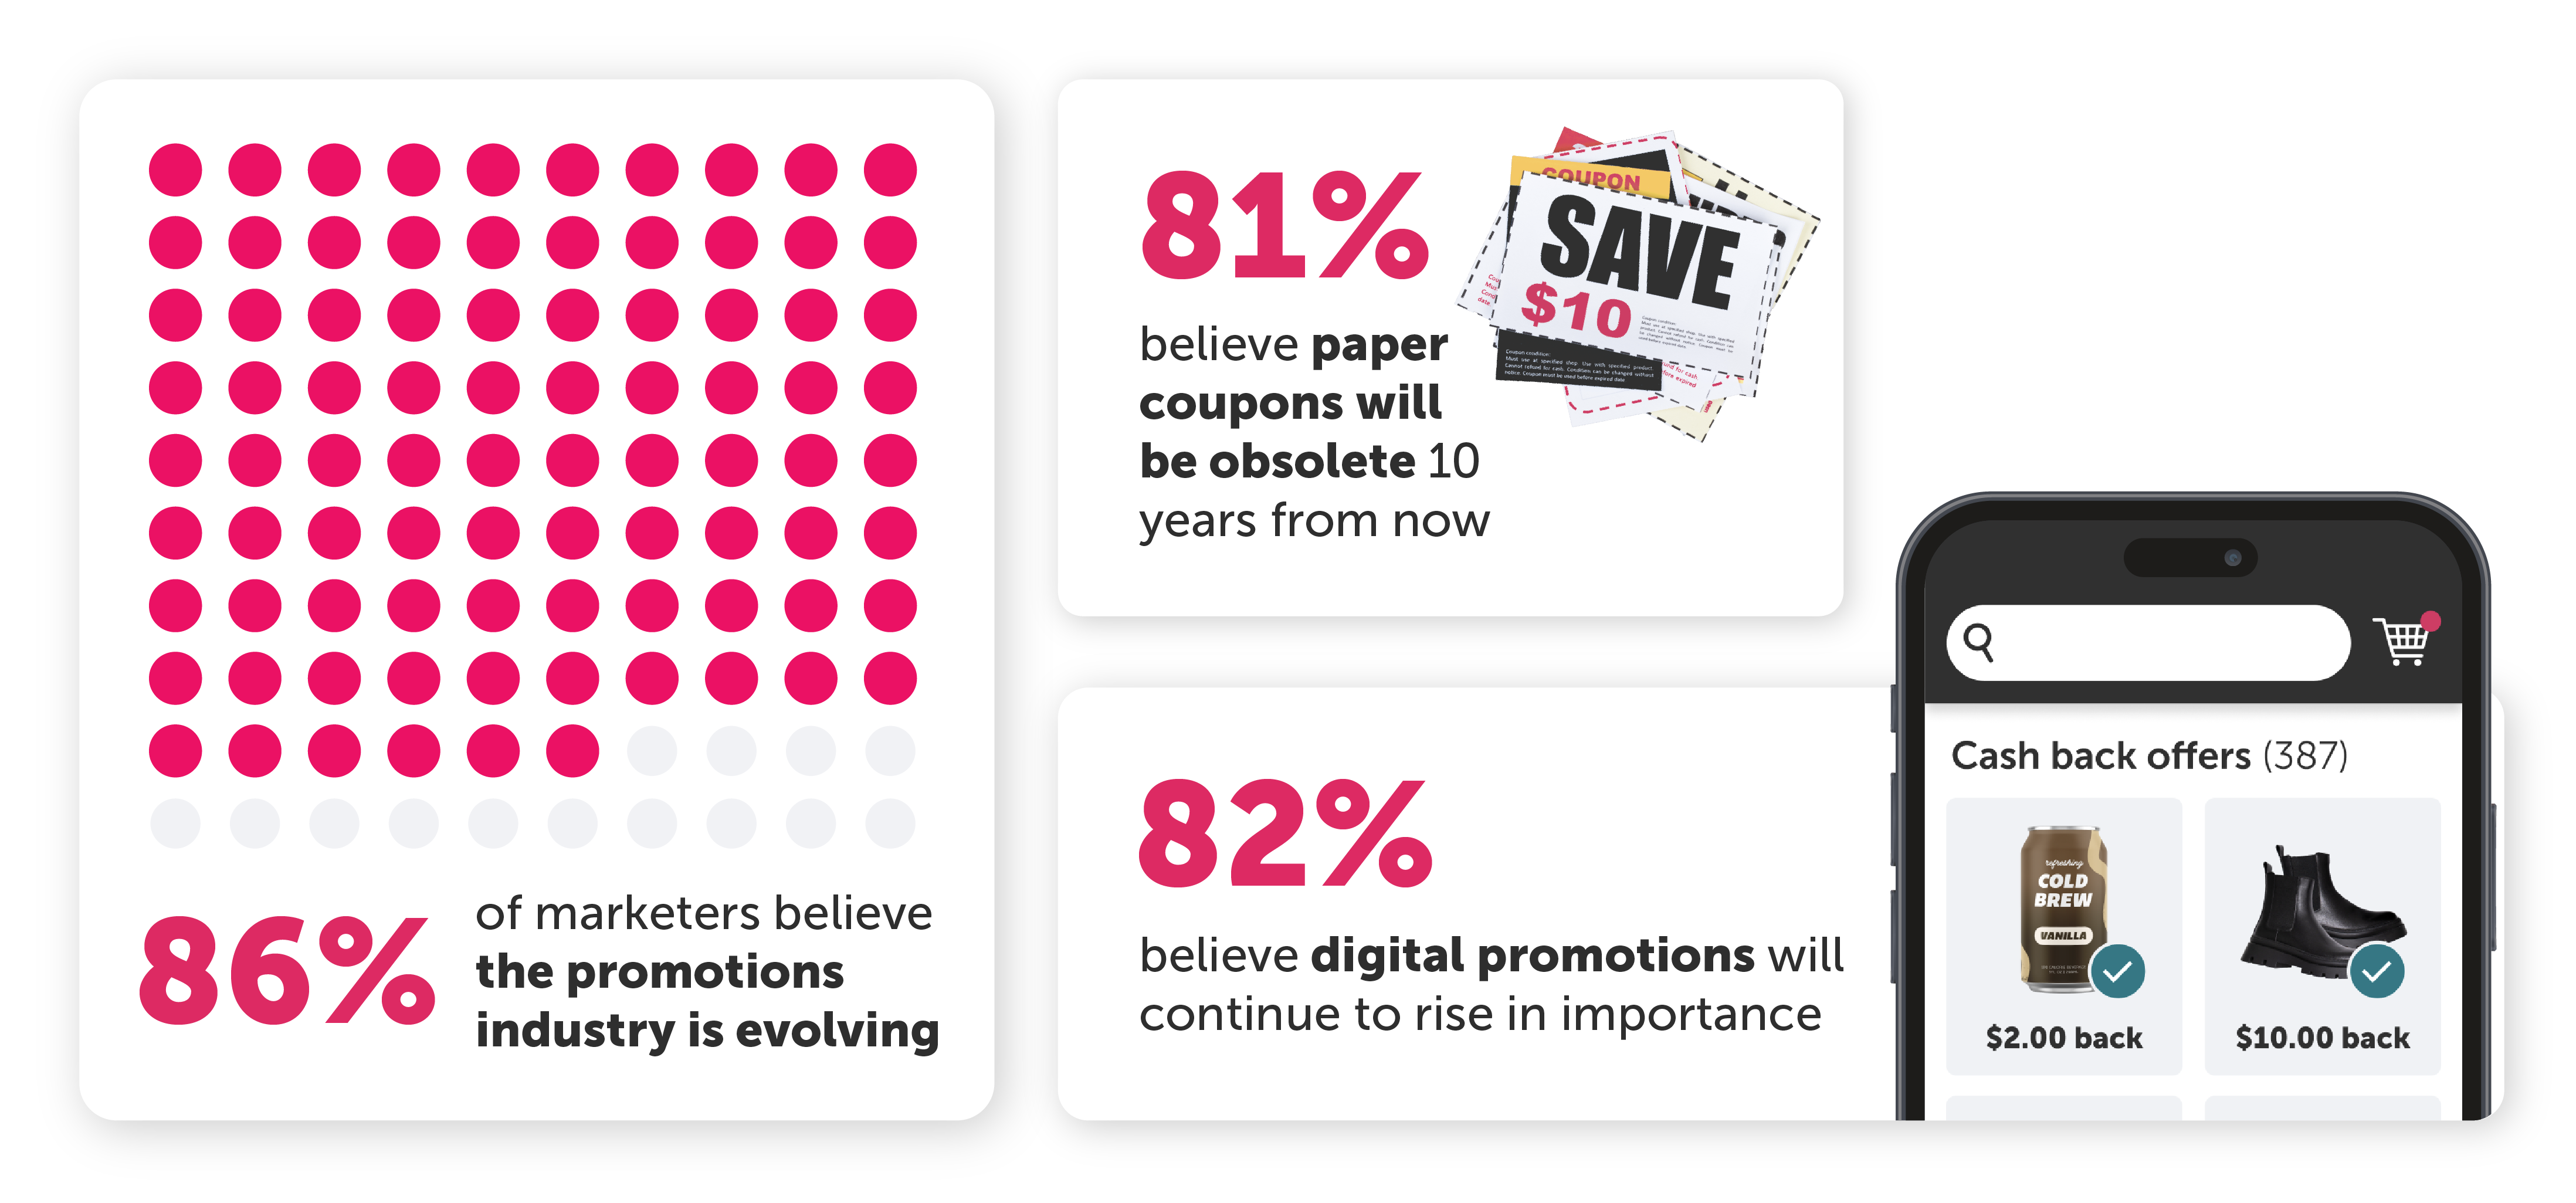
Looking ahead, marketers predict spend will continue moving toward mostly digital-first channels and away from traditional advertising, with digital promotions, social media marketing, and digital advertisements accelerating most rapidly. Most notably, 50% of the CPG marketers we surveyed believe digital promotions will be even more of a priority for them three years from now.
Loyalty programs and retail media networks are also emerging as major areas of investment for marketers in the future. Though spend on these tactics saw below-average net growth in 2024, marketers predict these channels will grow exponentially over the next three years.
This also hints at the growing obsolescence of paper coupons. Marketers widely acknowledge the evolving landscape of promotions, with a majority anticipating the growing prominence of digital promotions and a decline in the use of traditional paper coupons over the next decade.
Meeting the evolving demands of today’s consumers
The evolving economic landscape has ushered in a new era of consumer behavior and marketing strategies within the U.S. grocery sector. As shoppers become increasingly price sensitive and brand agnostic, marketers must adapt their strategies to meet these shifting demands. This entails a focus on digital promotions, personalized offers, and a deep understanding of consumer motivations.
To navigate this dynamic landscape and achieve sustainable growth, brands and retailers must leverage the power of data-driven insights and innovative marketing solutions. By understanding the nuances of consumer behavior and aligning their strategies accordingly, they can position themselves for success in the years to come




.png)
