As CPG brands look to maximize incremental sales during the summer months ahead, pay-per-sale strategies can incentivize consumer behavior, driving new-to-brand purchases, consumer loyalty, and market share.
Below you will find a deep dive into Ibotta research on where consumers stand and how brands can win this summer season by tapping into Ibotta’s 1st party data - highlighting historical trends.
Jump ahead to:
The current state of today’s shopper
Notable summer sub-categories & private label assessment
Tactics to maximize incremental sales this summer
The current state of today’s shopper
77% of consumers are prioritizing price over loyalty, according to recent Ibotta first-party survey findings. We know from past Ibotta research that consumers feel loyalty to brands who give them rewards. These findings validate the assumption that digital offers empower brands with an opportunity to tackle both price and loyalty with one singular tactic.
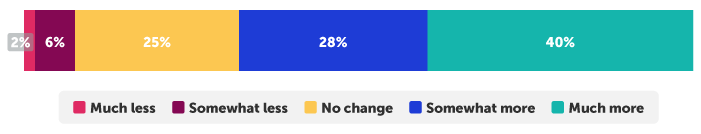
Regarding grocery specifically, at the time this article was written (February 2024), consumers say they are looking for deals and savings much more than they were at this time in 2023. And this is despite the improved US inflation rate compared to a year ago — in January 2023, the Consumer Price Index (CPI) increased by 6.41% over the previous year; in January 2024, this figure was 3.1%.¹
How often shoppers are looking for deals on groceries compared to this time last year.
How will the summer of 2024 unfold across the retail landscape? While 85% of consumers feel that grocery prices are rising, economists predict a slowdown. On one hand, household balance sheets remain healthy, so shoppers will be able to spend.² On the other hand, consumer spending and store trips continue to be down year over year — as highlighted in the monthly Category Deepdive series by the Ibotta Performance Network (IPN).
In fact, the most recent issue capturing January 2024 figures showed that on average across all categories assessed, dollar spend was down -10.7% and store trips were down -5.1% year-over-year (YoY). In the continuing pocketbook pinch, shoppers will be selective and discriminate — for brands, competition will only intensify.
Summer seasonality trends
Notable summer sub-categories & private label assessment
As summer heats up, it’s not all sunshine, lollipops and rainbows — Nielsen IQ data reveals several sub-categories of interest, how they fared in summer 2023 and where they stood in their vibrant battles against private label and value brands.
Sub-category breakdowns below are based on Summer 2023 overall sub-category growth measurements and private label market share increases of dollar spend and units moved, compared to one year prior and/or “Holiday” — time period of equal length from late Q3 through Q4 end-of-year (EOY) — as indicated.
Condiments
No backyard barbecue is complete without condiments, and you couldn’t quite say consumers were scrimping. Cutting back by only perhaps a drop or two less on their summer meals in 2023, the sub-category overall saw a negligible -0.1% decrease in units moved and a 10.8% increase in dollar spend due to a 7.6% increase in average price YoY. With the higher prices, private label spiced things up, winning market share in both dollar spend (+1.3%) and units moved (+1.4%) YoY.
Ice cream
When school’s out for summer, everyone screams for ice cream — especially perhaps the kids. Private label scooped up a kids’ cup portion of market share in dollar spend (0.7%), staying frozen in units moved (0.0%) YoY. It seems that for national brands in this sub-category, the competition remains heated exclusively among themselves.
Eggs
In the world of eggs, private label may be on the cusp of making a noticeable crack. The sub-category overall saw decreases on all fronts: average price (-23.58%); dollar spend (-20.86%); units moved (-1.96%) YoY. Weekend brunch warriors love their short-shelf-life eggs and will purchase ordinary volumes instead of stocking up when prices are dramatically down. Private label lost market share in dollar spend (-3.8%) but won by a basketful in units moved (4.1%) YoY.
Facial Cleaners
Consumers want to stay fresh and clean all summer long. Subtle differences in private label market share — 0.3% increase in dollar spend and -0.7% decrease in units moved YoY — indicate that national brands are holding their own within the sub-category. However, further investigation into the Summer ‘23 period, comparing it against “Holiday” ‘23 shows private label winning: market share increases of 5.8% in dollar spend and 5.6% in units moved. National brands should not underestimate private label as these brands may be hitting their glow up period — gaining consumer trust or becoming increasingly perceived as comparable quality items at lower prices.
Pest Control
Perhaps the little uninvited guests were coming in slightly bigger armies or maybe consumer preferences shifted. The sub-category overall saw a 0.5% purchase volume increase YoY, and private label lost market share in both dollar spend (-1.4%) and units moved (-1.8%) YoY.
Pet Food
Furry friends are certainly not forgotten in the summer. Might those extra walks and playtime in the park have pets working up their appetites and chowing down a bit more? Perhaps some pet owners are sharing table scraps because the sub-category overall saw a somewhat elastic demand with an average price hike of 11.6%, followed by increased dollar spend of 10.75%, and a decrease in units moved of only -0.9% YoY. Private label did see market share increases of 1.0% in dollar spend and 1.5% in units moved — these figures suggest that national brands may lead with their emotional connection and perceived higher quality over private label, but private label may be poised for the pounce.
Upper Respiratory
Were summer sniffles out of season in 2023, or were prices pressuring consumers to stay calm and carry on despite the sneezes? The sub-category overall saw an average price hike of 7.9% with plummeting dollar spend of -6.5% and units moved of -13.3% YoY. Private label actually only lost a fraction of a percentage point (-0.4%) of market share in units moved, gaining the slightest increase (0.1%) in units moved YoY. Further investigation into the Summer ‘23 period, comparing it against “Holiday” ‘23 shows unmistakeable private label market share losses of -13% in dollar spend and -12.6% in units moved. The broader medicine category overall during this same period showed a 4.1% increase in purchase volume. It seems that as cold and flu season ramps up, folks are more likely to reach for the items in this sub-category at the lower price point.
Not seeing your sub-category? Contact your Ibotta rep or inquire here to dig into insights relevant to your brand.
![]()
Tactics to maximize incremental sales this summer
The continued rise of price conscious shoppers is driving brands to leverage digital offers — which effectively incentivize new-to-brand purchases, brand loyalty, and customer advocacy. Digital offers give brands a high-impact avenue to connect with today’s shopper.
Looking to level-up your digital offers for outsized impact in summer ‘24? Brands are well advised to activate campaigns ahead of anticipated purchasing spikes for their sub-category and invest in consideration driving initiatives such as coordinated digital offers campaigns to remain top of mind throughout successive months.
The Ibotta Performance Network (IPN) is your one-stop-shop for first-party data analytics measuring both incentivized and organic purchases across all major US retail channels, in addition to maximized reach — brands on the IPN reach 91% of American households via the wide ecosystem of properties including Walmart, Dollar General, AppCard, Ibotta, and more.
Advertisers on the IPN average:
- 42% of conversions new-to-brand
- 50% lift in incremental units sold
- 7X return on ad spend (ROAS)
Brands, retailers, and advertisers who join the IPN gain access to deep insights and proprietary data to identify new opportunities for measurable growth.
Ready to optimize your summer strategy to drive your business forward with proven performance results? Contact your Ibotta rep or inquire here to learn more.
![]()