While January saw a surge in demand for healthier-choice items such as vitamins & oils, diet & nutrition, frozen vegetables, and frozen fruit, store trips and purchase volume continue to be down YoY across key categories.

Ibotta is a leading data source for both incentivized and organic purchases from in-store and online sales across all major US retail channels. Ibotta’s first-party SKU-level data provides insights into shopper behavior across over 3B lines of purchase data annually.

Explore the January YoY trends below and drill down into your sub-category by getting in touch with an Ibotta rep today.


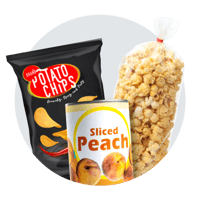
General Food

General Food

-2.6% store trips vs. 1 year ago
-5.6% dollar spend vs. 1 year ago
-6.3% units moved vs. 1 year ago
+4.8% share of purchases shifted to private label

Beverage
Beverage

-4.2% store trips vs. 1 year ago
-4.8% dollar spend vs. 1 year ago
-9.3% units moved vs. 1 year ago
+0.5% share of purchases shifted to private label

Household Needs
Household Needs

+0.1% store trips vs. 1 year ago
+1.3% dollar spend vs. 1 year ago
-2.0% units moved vs. 1 year ago
+7.1% share of purchases shifted to branded

Health Beauty
Health & Beauty

-8.3% store trips vs. 1 year ago
-5.4% dollar spend vs. 1 year ago
-12.5% units moved vs. 1 year ago
+9.9% share of purchases shifted to private label

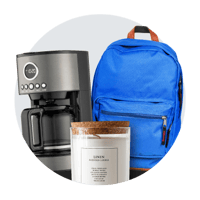
General Merch
General Merchandise

-10.5% store trips vs. 1 year ago
-10.7% dollar spend vs. 1 year ago
-16.2% units moved vs. 1 year ago
+3.6% share of purchases shifted to branded


CTA spectrum color bar

Achieve your brand goals

Which metrics are most important for your brand? Get in touch to explore possibilities with the Ibotta Performance Network.
Get in touch CTA Button