While December saw a surge in sales for classic holiday items such as gift cards, sugar candy, hot cocoa, pretend play, and party supplies, store trips and purchase volume continue to be down YoY across key categories.

Ibotta is a leading data source for both incentivized and organic purchases from in-store and online sales across all major US retail channels. Ibotta’s first-party SKU-level data provides insights into shopper behavior across over 3B lines of purchase data annually.

Explore the December YoY trends below and drill down into your sub-category by getting in touch with an Ibotta rep today.
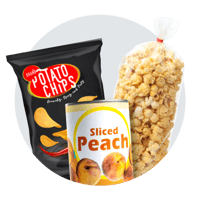


General Food

General Food

-1.8% store trips vs. 1 year ago
-6.8% dollar spend vs. 1 year ago
-8.2% units moved vs. 1 year ago
+3.9% share of purchases shifted to private label

Beverage
Beverage

-3.0% store trips vs. 1 year ago
-4.8% dollar spend vs. 1 year ago
-7.0% units moved vs. 1 year ago
+3.2% share of purchases shifted to branded

Household Needs
Household Needs

-0.3% store trips vs. 1 year ago
+2.8% dollar spend vs. 1 year ago
-2.5% units moved vs. 1 year ago
+7.0% share of purchases shifted to branded

Health Beauty
Health & Beauty

-8.9% store trips vs. 1 year ago
-8.1% dollar spend vs. 1 year ago
-15.3% units moved vs. 1 year ago
+20.7% share of purchases shifted to private label

General Merch
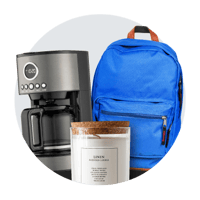
General Merchandise

-9.6% store trips vs. 1 year ago
-15.0% dollar spend vs. 1 year ago
-19.5% units moved vs. 1 year ago
+10.6% share of purchases shifted to branded


Planning Ahead?

Identify over-indexing categories and track seasonal buying behavior by month with the Category Pacesetters web tool.