June 5, 2024
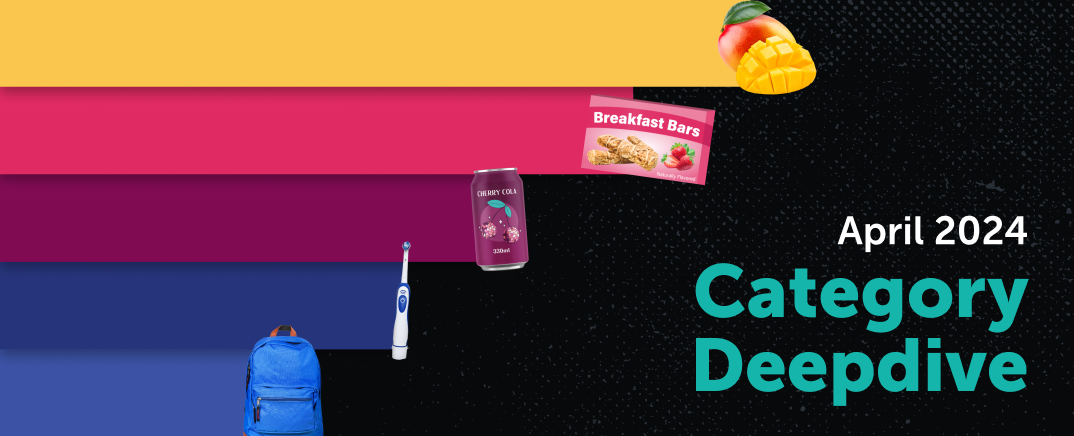
The month of April brought headwinds for brands across all categories, providing further evidence that consumers are still feeling the squeeze of inflation. It’s no surprise, then, that we also saw private label brands capture more market share in three out of the five categories we report on: food, healthy & beauty, and general merchandise.
Health & beauty and general merchandise, in particular, took the biggest hits in April, with monthly store trips, dollars spent, and units moved all down by at least 15% YoY. Health & beauty also saw a 14.3% shift to private label brands, indicating that shoppers are willing to compromise on brand names when it comes to things like supplements and cosmetics — but not on price.
But while brands may not be immune to these market forces, they aren’t helpless to them either. Ibotta is a leading data source for both incentivized and organic purchases from in-store and online sales across all major U.S. retail channels. Ibotta’s first-party SKU-level data provides insights into shopper behavior across more than 3 billion lines of purchase data annually. By leveraging this data strategically, brands can find ways to stand out and win back critical market share.
Explore the April YoY trends below and drill down into your sub-category by getting in touch with an Ibotta rep today.
_Eblast-General%20Food.png?width=200&height=200&name=Category%20Deepdive%20YoY%20-%20Linkedin%20(Apr%202024)_Eblast-General%20Food.png)
_Eblast-Beverages.png?width=200&height=200&name=Category%20Deepdive%20YoY%20-%20Linkedin%20(Apr%202024)_Eblast-Beverages.png)
_Eblast-Household%20Items.png?width=200&height=200&name=Category%20Deepdive%20YoY%20-%20Linkedin%20(Apr%202024)_Eblast-Household%20Items.png)
_Eblast-Health%20and%20Beauty.png?width=200&height=200&name=Category%20Deepdive%20YoY%20-%20Linkedin%20(Apr%202024)_Eblast-Health%20and%20Beauty.png)
_Eblast-General%20Merchandise.png?width=200&height=200&name=Category%20Deepdive%20YoY%20-%20Linkedin%20(Apr%202024)_Eblast-General%20Merchandise.png)
![]()
Achieve your brand goals
Which metrics are most important for your brand? Get in touch to explore possibilities with the Ibotta Performance Network.