Ibotta’s first-party data shows April ‘23 delivered a combined -6% fewer trips to the store, -6% drop in units moved, and +5% growth in share of purchases shifting to private label — YoY across key categories.

These trends mean that, for both brands and retailers, it’s critical now to focus on pre-shopping tactics that drive store trips and unit sales. Ibotta users unlock 8 offers on average, 7 days prior to redeeming. This is a powerful step to influencing a shopper’s path to purchase.

View the April ‘23 stats below and contact your Ibotta rep to dive deeper into your specific category to build a custom promotional strategy that drives incremental sales at unprecedented scale.  


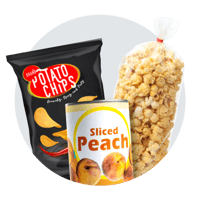
General Food

General Food

-4.9% store trips vs. 1 year ago
+4.2% dollar spend vs. 1 year ago
-5.1% units moved vs. 1 year ago
+7.8% share of purchases shifted to private label

Beverage
Beverage

-5.5% store trips vs. 1 year ago
+0.8% dollar spend vs. 1 year ago
-7.1% units moved vs. 1 year ago
+7.5% share of purchases shifted to private label

Household Needs
Household Needs

-5.0% store trips vs. 1 year ago
+1.3% dollar spend vs. 1 year ago
-4.6% units moved vs. 1 year ago
+1.7% share of purchases shifted to branded

Health Beauty
Health & Beauty

-9.6% store trips vs. 1 year ago
+0.8% dollar spend vs. 1 year ago
-10.7% units moved vs. 1 year ago
+3.8% share of purchases shifted to private label

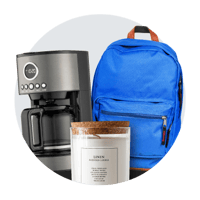
General Merch
General Merchandise

-7.0% store trips vs. 1 year ago
-4.1% dollar spend vs. 1 year ago
-0.4% units moved vs. 1 year ago
+8.2% share of purchases shifted to private label


Planning Ahead?

Identify over-indexing categories and track seasonal buying behavior by month with the Category Pacesetters web tool.